
At FalconForce, we like to understand the tools that we work with. One of the tools we use a lot on the blue side is MDE: Microsoft Defender for Endpoint, formerly Microsoft Defender ATP. In an effort to to understand how MDE sends logs to the M365 cloud environment, we found a nice trick to debug protected processes, as well as a vulnerability in MDE that was reported to Microsoft back in August 2021 and received CVE-2022–23278.
This will be a blog post in three parts. First, some tips and tricks to debug protected processes. Then we will dive into the actual vulnerability that we discovered once the MDE process could be properly debugged. And finally we will have a quick look at the fix that Microsoft made to address the vulnerability.
TL;DR — You can debug MDE running on an endpoint by running dbgsrv.exe and raising its PPL protection to WinTcb. This can be used to snoop on data being transmitted by MDE to the cloud. We identified a vulnerability related to missing authorization checks of data sent from the MDE endpoint to the M365 cloud, allowing anyone to send spoofed data to any M365 tenant.
Part 1 — Debugging protected processes
To achieve our goal of observing traffic sent by the MDE process to the M365 cloud, we need to be able to debug the MDE process. The main process that is involved in this is the MsSense.exe process.
We can use the awesome ProcessHacker tool to inspect the protections of a program.
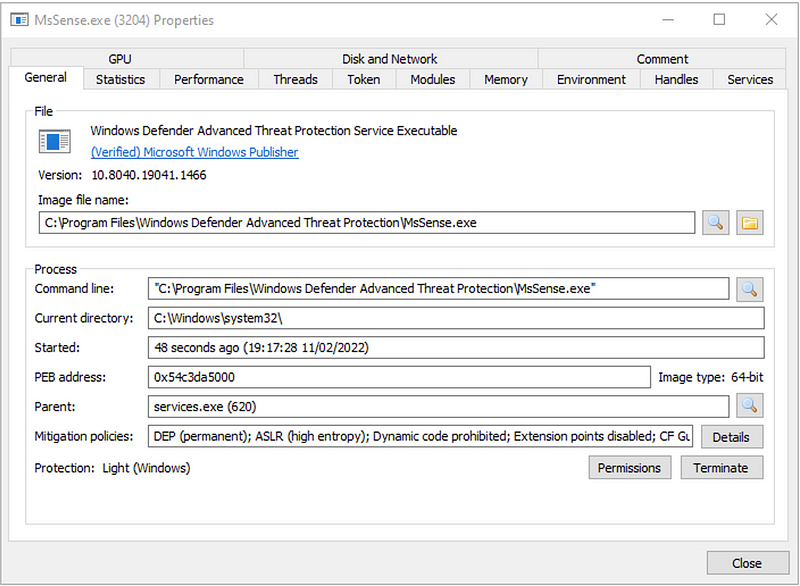
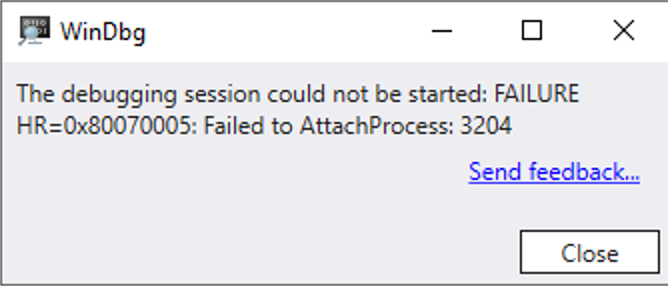
If we try to attach a debugger to the process, this will fail; even when we run the debugger from the SYSTEM account with TrustedInstaller privileges.
Various tools are available to manipulate the protection attribute of the MsSense.exe program. One example is PPLKiller by Acebond that can remove the PPL protection flags from a running process by using a vulnerable driver to manipulate kernel memory.
Lowering the protection level using PPLKiller was the first thing we tried to be able to debug MsSense.exe, but unfortunately it still results in the same permission denied error in WinDbg. We had some past experience with Windows Kernel-Mode debugging. This allows you to debug these protected processes, but it is very inconvenient since the entire machine freezes whenever a break-point triggers in the debugger. Luckily, we found a better way: instead of lowering the protection level of MsSense.exe, what if we raise the protection level of our debugger.
Raising the protection level of the debugger
By default, PPLKiller only allows removing of PPL privileges, but the same mechanism can be used to add these privileges to an existing process. We contributed a patch to PPLKiller that adds a /enablePPL option to increase the protection level of an existing process. The trick to getting this to work reliably is to apply this not to the WinDbg process itself, but to use the debug server dbgsrv.exe process.
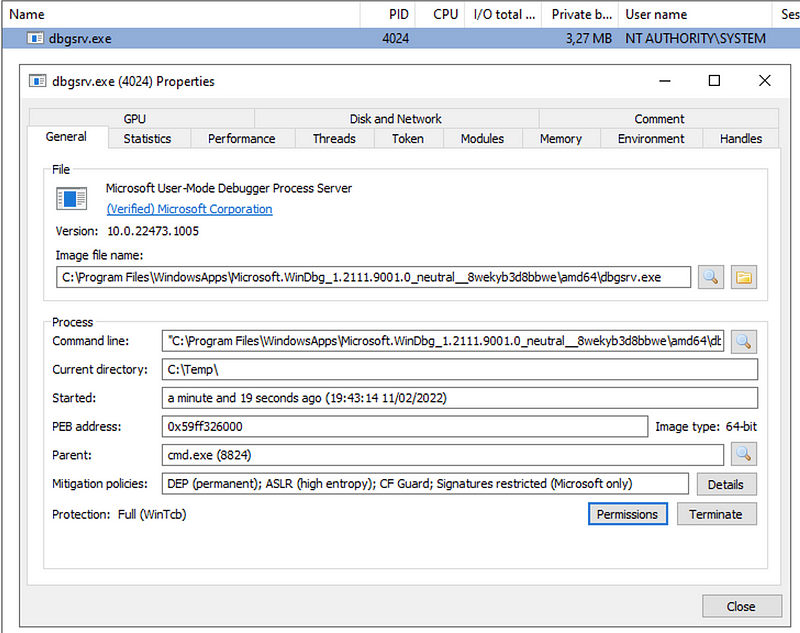
First, we start the dbgsrv.exe process listening on localhost port 1234 (any port will do) running under the SYSTEM account.
"C:\Program Files\WindowsApps\Microsoft.WinDbg_1.2111.9001.0_neutral__8wekyb3d8bbwe\amd64\dbgsrv.exe" -t tcp:server=127.0.0.1,port=1234
Now, the patched version of PPLKiller can be used to raise the protection level of this debug server:
> tasklist | findstr dbgsrv
dbgsrv.exe                   4024
>.\PPLKiller.exe /enablePPL 4024
PPLKiller version 0.3 by @aceb0nd
[+] Windows Version 2009 Found
[*] Device object handle has been obtained
[*] Ntoskrnl base address: FFFFF80720800000
[*] PsInitialSystemProcess address: FFFF90032906D080
[*] Current process address: FFFF900330580080
[*] Enabling PPL protection for process.
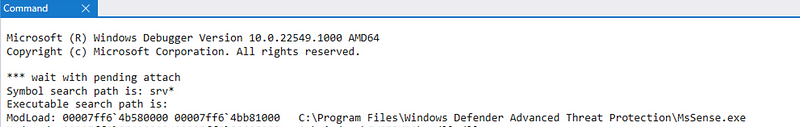
After the protection level of dbgsrv.exe has been raised, it can be used to debug MsSense.exe.
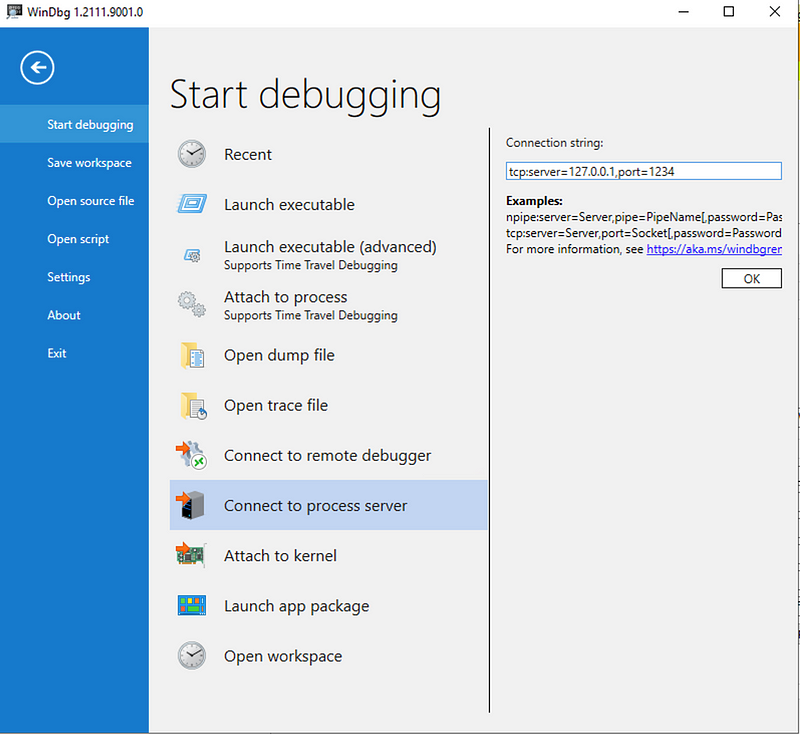
Via the dbgsrv.exe process (running as SYSTEM with increased PPL protection level), we can attach to MsSense.exe.
Observing plain-text of TLS encrypted traffic
All communication between MsSense.exe and the M365 cloud environment takes place over TLS using certificate pinning. This is done to ensure an Adversary-in-the-Middle attack using tools such as Burp is blocked, even if a rogue CA certificate can be installed on the device.
Now we have the debugger attached to the process, we can use this to intercept TLS-encrypted traffic before it gets encrypted. To do this we can place a break-point on SspiCli!EncryptMessage. This is the function that handles the encryption as part of the TLS protocol.
A break-point can be set using:
> bu SspiCli!EncryptMessage
We can now resume the process using the ‘g’ command in the debugger. Once the process hits the EncryptMessage function, the debugger will break the program:
Breakpoint 0 hit
SspiCli!EncryptMessage:
00007ff8`53a91be0 4053            push    rbx
The arguments to EncryptMessage are documented on this Microsoft website:
SECURITY_STATUS SEC_ENTRY EncryptMessage(
  [in] PCtxtHandle phContext,
  [in] unsigned long fQOP,
  [in, out] PSecBufferDesc pMessage,
  [in] unsigned long MessageSeqNo
);
We are interested in the pMessage, since that contains the message. This is the third argument to the function, which is passed in the r8 register as documented in the Windows calling convention. The r8 register contains a pointer to a SecBufferDesc structure:
typedef struct _SecBufferDesc {
  unsigned long ulVersion;
  unsigned long cBuffers;
  PSecBuffer pBuffers;
} SecBufferDesc, *PSecBufferDesc;
Here, the pBuffers element is interesting. It is located at offset 8 (both unsigned long elements before it take 4 bytes). We can use the following command in WinDbg to view the pBuffers element, which contains multiple SecBuffers. Note that the poi function is used to de-reference a pointer in WinDbg.
0:039> dq(poi(@r8+8))
00000054`c4bff070  00000007`0000000d 00000235`ea69c040
00000054`c4bff080  00000001`000003f9 00000235`ea69c04d
00000054`c4bff090  00000006`00000010 00000235`ea69c446
00000054`c4bff0a0  00000000`00000000 00000000`00000000
00000054`c4bff0b0  0000a2a8`14726248 00000000`00000000
00000054`c4bff0c0  00000000`00000000 00000235`e584ee60
00000054`c4bff0d0  00000235`e584e600 00000000`00000000
00000054`c4bff0e0  00000235`eb164500 00000235`eb164500
The SecBuffer type is defined as follows:
typedef struct _SecBuffer {
  unsigned long cbBuffer;
  unsigned long BufferType;
  char *pvBuffer;
}
Finally, the pvBuffer element is what contains the data to be encrypted. This is again located at offset 8, since there are again two unsigned long elements of 4 bytes in front of it.
After some poking around, it turns out the second SecBuffer (with type 00000001) is what actually contains the clear-text data. We can extract it as follows. Note that the 0n16*1 can be modified to dump the other buffers as well.
> db poi(poi(@r8+8)+8+0n16*1) L0n192
50 4f 53 54 20 2f 4f 6e-65 43 6f 6c 6c 65 63 74  POST /OneCollect
6f 72 2f 31 2e 30 20 48-54 54 50 2f 31 2e 31 0d  or/1.0 HTTP/1.1.
0a 43 61 63 68 65 2d 43-6f 6e 74 72 6f 6c 3a 20  .Cache-Control:
6e 6f 2d 63 61 63 68 65-0d 0a 43 6f 6e 6e 65 63  no-cache..Connec
74 69 6f 6e 3a 20 4b 65-65 70 2d 41 6c 69 76 65  tion: Keep-Alive
0d 0a 43 6f 6e 74 65 6e-74 2d 54 79 70 65 3a 20  ..Content-Type:
61 70 70 6c 69 63 61 74-69 6f 6e 2f 78 2d 6a 73  application/x-js
6f 6e 2d 73 74 72 65 61-6d 3b 20 63 68 61 72 73  on-stream; chars
65 74 3d 75 74 66 2d 38-0d 0a 43 6f 6e 74 65 6e  et=utf-8..Conten
74 2d 45 6e 63 6f 64 69-6e 67 3a 20 64 65 66 6c  t-Encoding: defl
61 74 65 0d 0a 41 63 63-65 70 74 3a 20 61 70 70  ate..Accept: app
6c 69 63 61 74 69 6f 6e-2f 6a 73 6f 6e 0d 0a 41  lication/json..A
The POST headers and the POST body are encrypted using separate calls to EncryptMessage. Therefore, only the POST headers are shown here.
If we want to observe the POST body, we need to continue the execution until the next break-point is hit. Note that if the program was paused for a long time on the first break-point, the underlying TLS connection will have timed out and a new request will be made before the POST body can be observed.
The POST body looks strange when we view it:
> db poi(poi(@r8+8)+8+0n16*1)
b5 5b 59 6f ea 4a 97 7d-6f a9 ff c3 55 9e ba 95  .[Yo.J.}o...U...
9b 73 3c 60 02 47 ea 07-1b 0f 31 49 99 18 3c 60  .s<`.G....1I..<`
f7 6d b5 c0 26 18 0f 40-02 c4 e0 4f f7 bf f7 da  .m..&[email protected]....
36 19 70 4e e7 93 5a ea-48 88 60 97 ab 6a 4f 6b  6.pN..Z.H.`..jOk
af 5d 55 fe c7 d5 eb e2-e5 ea d7 55 e7 07 77 f5  .]U........U..w.
That didn’t look like a proper POST body, until we realized there is a Content-Encoding: deflate in the POST headers, indicating that the POST body is compressed.
We can see the size of the compressed data in the cbBuffer field which is located 8 bytes before the pointer to the compressed data:
> dd poi(@r8+8)+0n16*1 L1
00000054`c41fe7e0  00001c42
We can now write this to a file:
> .writemem c:\temp\request.raw  poi(poi(@r8+8)+8+0n16*1) l1c42
Writing 1c42 bytes....
This file can be decompressed in various ways. For example, by using a simple Python script:
import zlib
import sys
f = open(sys.argv[1],'rb')
o = open(sys.argv[1]+'.out','wb')
o.write(zlib.decompress(f.read(), -15))
If we run this on the request.raw file, we get a request.raw.out file which finally contains the decrypted payload. It turns out that this actually a JSON format:
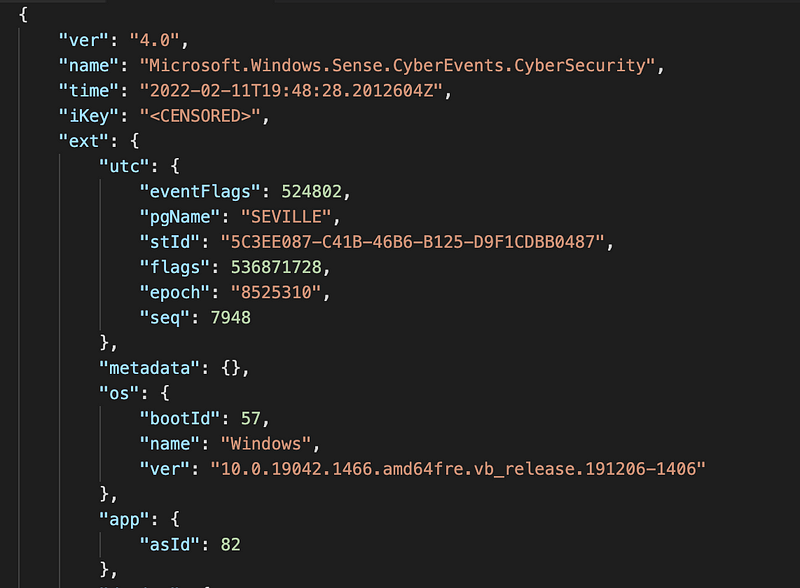
The actual events are base64-encoded inside the JSON data:
"data": {
   "events": "rQkLAQ9HZ...snip"
Decoding this base64 yields the events in a binary format. They appear to be serialized using the Microsoft Bond serialization framework, which is similar to the more commonly-used Protobuf framework.
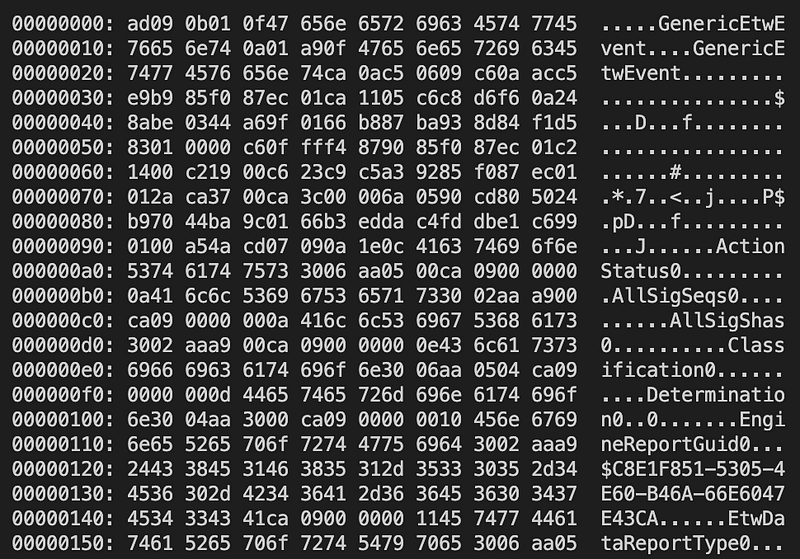
These are the actual events that are being ingested into the M365 cloud.
Part 2 — The vulnerability
Now we know how the data is sent from MDE on our device to the M365 cloud, we can finally look at the vulnerability.
To understand the vulnerability, we have to look at the id portion of the JSON that is sent:
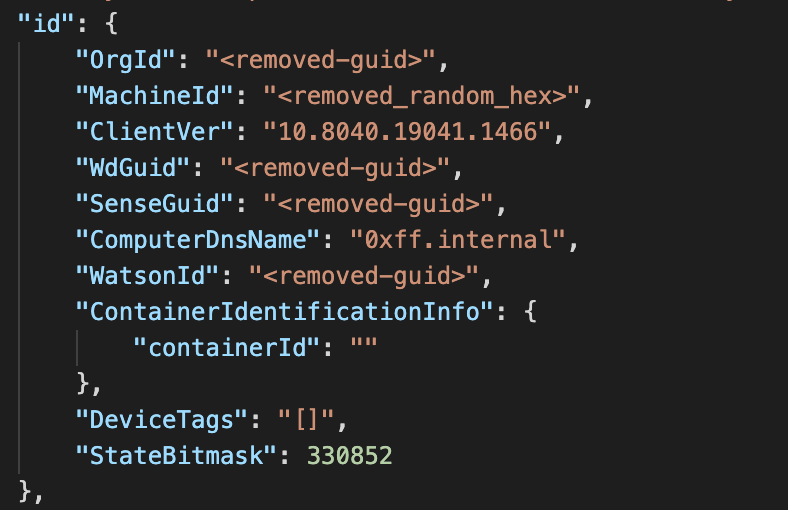
It turns out that the metadata about the events being sent, is located in the id portion of the JSON data. This contains the OrgId which is a GUID that represents the identifier of the organization where these logs will be delivered to, as well as the MachineId and ComputerDnsName that will end in the M365 portal as the originators of the event.
We also need to look at the headers of the POST request:
POST /OneCollector/1.0 HTTP/1.1
Cache-Control: no-cache
Connection: Keep-Alive
Content-Type: application/x-json-stream; charset=utf-8
Content-Encoding: deflate
Accept: application/json
Accept-Encoding: gzip, deflate
User-Agent: MSDW
Upload-Time: 2022-02-11T20:12:22.443Z
Reliability-Mode: medium
Client-Version: UTC-Windows-C++-no-10.0.19042.1466.amd64fre.vb_release.191206-1406-no
ApiKey: <removed>
AuthMsaDeviceTicket: <removed>
Content-Length: 7234
Host: eu-v20.events.data.microsoft.com
Authentication is based on an ApiKey — that turns out to be static and shared for all MDE clients — and a AuthMsaDeviceTicket. However, this ticket turns out to be optional and can be replaced with a header specifying: Client-Id: NO_AUTH, bypassing authentication altogether.
The vulnerability is that there is no proper authorization in place which proves the sender is authorized to send on behalf of a specific device and organization. This means that anyone can send data on behalf of any organization and machine, simply by manipulating the MachineId, OrgId and ComputerDnsName fields. This also works cross-tenant, allowing sending logs to another tenant, if the GUID of that tenant is known. This GUID can be obtained by any user in the organization or from any machine enrolled in MDE.
As a proof of concept, we captured some events from our tenant and replayed those events 20 times to a different tenant (that we also own), spoofing the MachineId and ComputerDnsName fields. It turns out that in case a MachineId does not yet exist, a new Device will be added to MDE with the details provided.
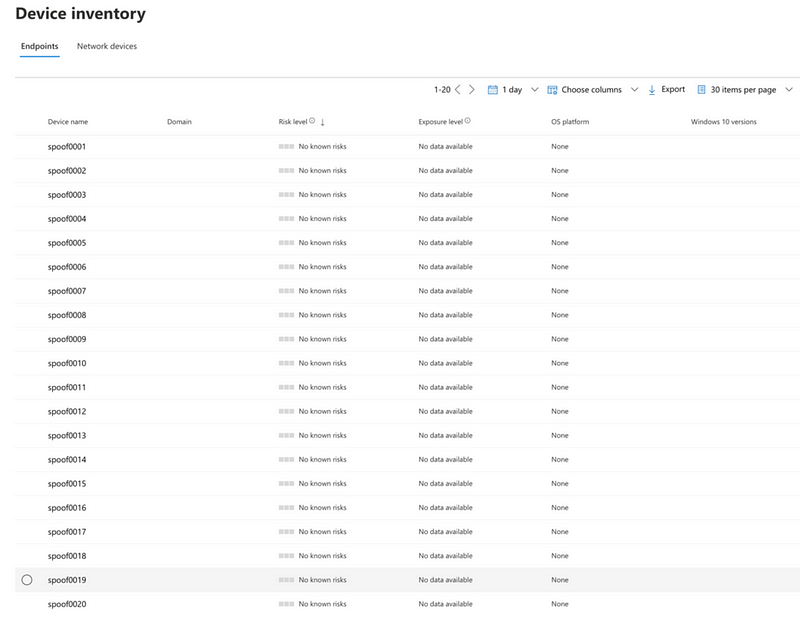
Implications
Using this vulnerability, an attacker could send any number of spoofed events to any M365 environment when the OrgId is known. These events could include spoofed alerts that would trigger fake incidents being created for a SOC to investigate, causing great confusion about which incidents are real and which have been manipulated.
Part 3 — The Fix
On March 8, 2022 Microsoft released a patch for the vulnerability as part of the March Patch Tuesday and some additional guidance on the MSRC blog.
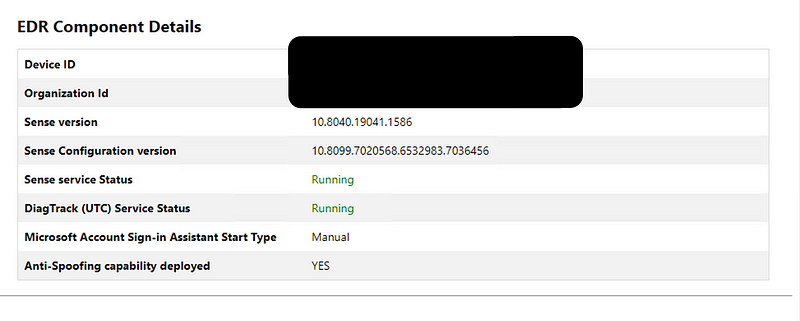
The patch requires an update to the MDE client, adding anti-spoofing measures. The Microsoft Defender for Endpoint client analyzer tool can be used to check whether a specific machine has been updated and the anti-spoofing measures are now enabled. Below is the output on a machine that has been fully patched:
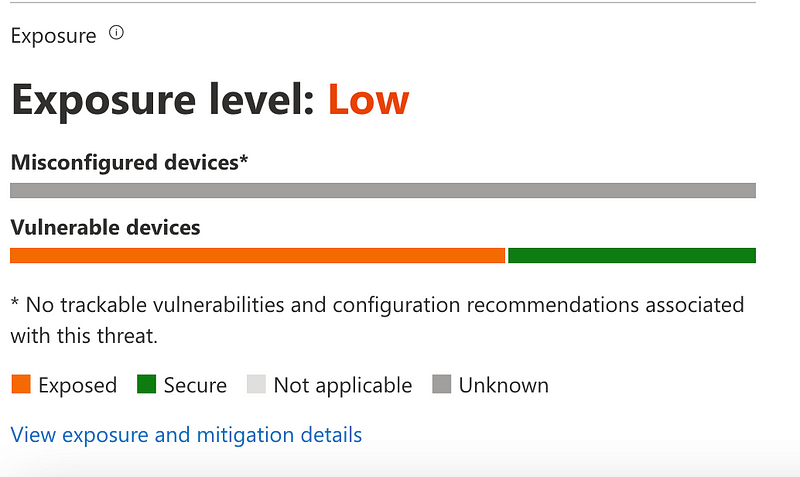
Besides the patch, Microsoft also added the vulnerability to the Microsoft 365 Defender portal as a threat, which provides a dashboard showing the number of vulnerable devices in an environment.
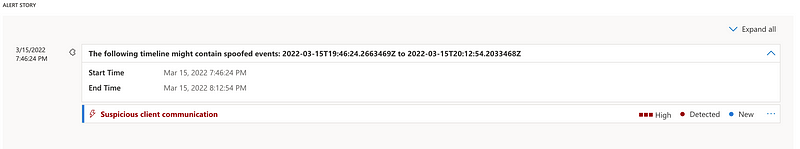
A new alert was also added, which is triggered when exploitation attempts of the vulnerability occur against a target environment. This alert is titled “Suspicious client communication”. We managed to trigger this alert in our test environment by running our original PoC code which transmits spoofed events, but it only triggered when we targeted the DeviceId of a fully patched machine.
Technical details on the fix
The fix adds a new mechanism to authenticate a device sending logs, using a signed JWT-like token that is passed in a newly added HTTP header named Custom-Request-Field.
The screenshot below shows an example of a decoded JWT token that was taken from the Custom-Request-Field header of a device that has a fully patched version of Microsoft Defender for Endpoint.
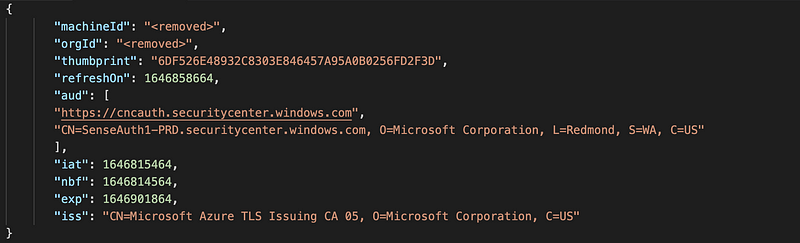
The screenshot shows that the machineId and the orgId are part of this JWT token. These values can be used to identify spoofing when they do not match the orgId and machineId in the actual request.
It appears that Microsoft has also implemented additional measures, limiting the ability to send data on behalf of a non-existing MachineId. These events appear to be dropped and no longer end up in the logging that is contained in the MDE portal.
Timeline
- 17 Aug 2021 — Reported vulnerability via Microsoft MSRC portal.
- 20 Aug 2021 — Additional information provided to Microsoft including Python PoC code to exploit.
- 15 Sep 2021 — Vulnerability is acknowledged by Microsoft.
- 4 Nov 2021 — The Microsoft team requests additional time before the issue can be fixed, asking to postpone any publications.
- 20 Nov 2021 — The Microsoft team informs us that fixing is complex and will require more time.
- 7 Feb 2022 — Information received that CVE-2022–23278 will be assigned and the vulnerability will be patched as part of the March Patch Tuesday.
- 8 Mar 2022 — Patch released by Microsoft.
- 1 April 2022 — FalconForce blog post with full details released; intentionally delayed to give organizations sufficient time to patch the vulnerability.
Knowledge center
Other articles

FalconFriday: Need for Speed: going underground with near-real-time (NRT) rules – 0xFF26
[dsm_breadcrumbs show_home_icon="off" separator_icon="K||divi||400" admin_label="Supreme Breadcrumbs" _builder_version="4.18.0" _module_preset="default" items_font="||||||||" items_text_color="rgba(255,255,255,0.6)" custom_css_main_element="color:...

How data science can boost your detection engineering maintenance and keep you from herding sheep
[dsm_breadcrumbs show_home_icon="off" separator_icon="K||divi||400" admin_label="Supreme Breadcrumbs" _builder_version="4.18.0" _module_preset="default" items_font="||||||||" items_text_color="rgba(255,255,255,0.6)" custom_css_main_element="color:...

Microsoft Defender for Endpoint Internal 0x06 – Custom Collection
[dsm_breadcrumbs show_home_icon="off" separator_icon="K||divi||400" admin_label="Supreme Breadcrumbs" _builder_version="4.18.0" _module_preset="default" items_font="||||||||" items_text_color="rgba(255,255,255,0.6)" custom_css_main_element="color:...

FalconForce realizes ambitions by working closely with its customers in a methodical manner, improving their security in the digital domain.
Energieweg 3
3542 DZ Utrecht
The Netherlands
FalconForce B.V.
[email protected]
(+31) 85 044 93 34
KVK 76682307
BTW NL860745314B01