
When attackers gain access to a large corporate environment, one of the things they tend to do is extract large quantities of data from Active Directory. The extracted data can be analyzed using tools to find complex paths that allow privilege escalation and lateral movement.
Popular tools to collect data from Active Directory are:
- SharpHound, which is provided as part of BloodHound and is intended to effectively collect large quantities of data from an Active Directory environment.
- AD Explorer, provided by Microsoft as part of the Sysinternals suite, which can be used to interactively browse an Active Directory, as well as generate a complete snapshot of the Active Directory in a file. This snapshot file can be loaded into BloodHound using the awesome ADExplorerSnapshot.py tool by Cedric van Bockhaven.
In this article we will discuss three different methods that can be used to detect data collection from Active Directory:
- Client-side LDAP query logging via Microsoft Defender for Endpoint.
- Domain controller LDAP query logging via Microsoft Defender for Identity.
- Domain controller object access logging via SACLs and audit policies.
Detection method 1 — Client-side LDAP query logging
Microsoft Defender for Endpoint collects LDAP queries performed on monitored endpoints using a user-space ETW provider called ‘Microsoft-Windows-LDAP-Client’. LDAP queries are logged to the DeviceEvents table using the ‘LdapSearch’ action type.
The screenshot below shows an example of an LdapSearch event.
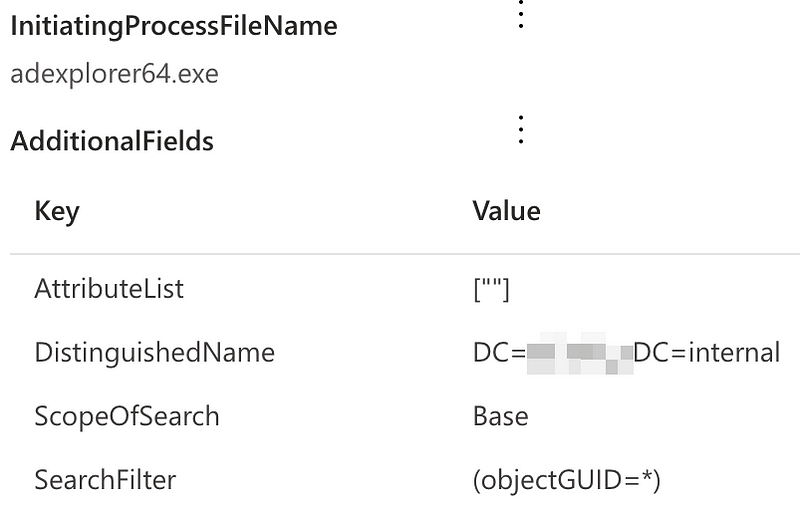
The filter used for the LDAP search is available in the AdditionalFields.SearchFilter field. It turns out that some of the collection tools have very specific filters that can be used as an IoC to detect these tools:
- AD Explorer uses ‘objectGUID=*’ in many of its queries, which is very distinctive of this tool.
- SharpHound uses various distinctive patterns, for example,
(|(samaccounttype=268435456)(samaccounttype=268435457)(samaccounttype=536870912)(samaccounttype=536870913))
Knowing this, we can write a detection that searches for these IOCs in the LDAP search filter.
The query is available on our Github account.
Below is a list of pros and cons for this way of detecting the technique:
- Pro — Easy to deploy, since the detection only relies on Microsoft Defender for Endpoint to be deployed; no custom configuration is required.
- Con — Will only detect the data collection if it is performed from an MDE-monitored endpoint directly. It will not be detected when it is, for example, executed from an attacker-controlled machine via a SOCKS proxy.
- Con — Depends on IoCs that an attacker might be able to modify by changing the source code of the collection tool.
- Con — Since it relies on user-space ETW tracing, an attacker can disable these logs by using a user-space ETW patch — using a tool such as InlineExecute-Assembly.
- Con — MDE has a list of processes for which LDAP query logging is not performed. Finding this list is left as an exercise for the reader 😉
Detection method 2 — Domain controller LDAP query logging via Microsoft Defender for Identity
Microsoft Defender for Identity (MDI) provides a log of LDAP queries being executed against the domain controller in the IdentityQueryEvents table that can be queried via Advanced Hunting. LDAP queries are logged using the ‘LDAP query’ action type.
Below is an example of an LDAP query logged via MDI.
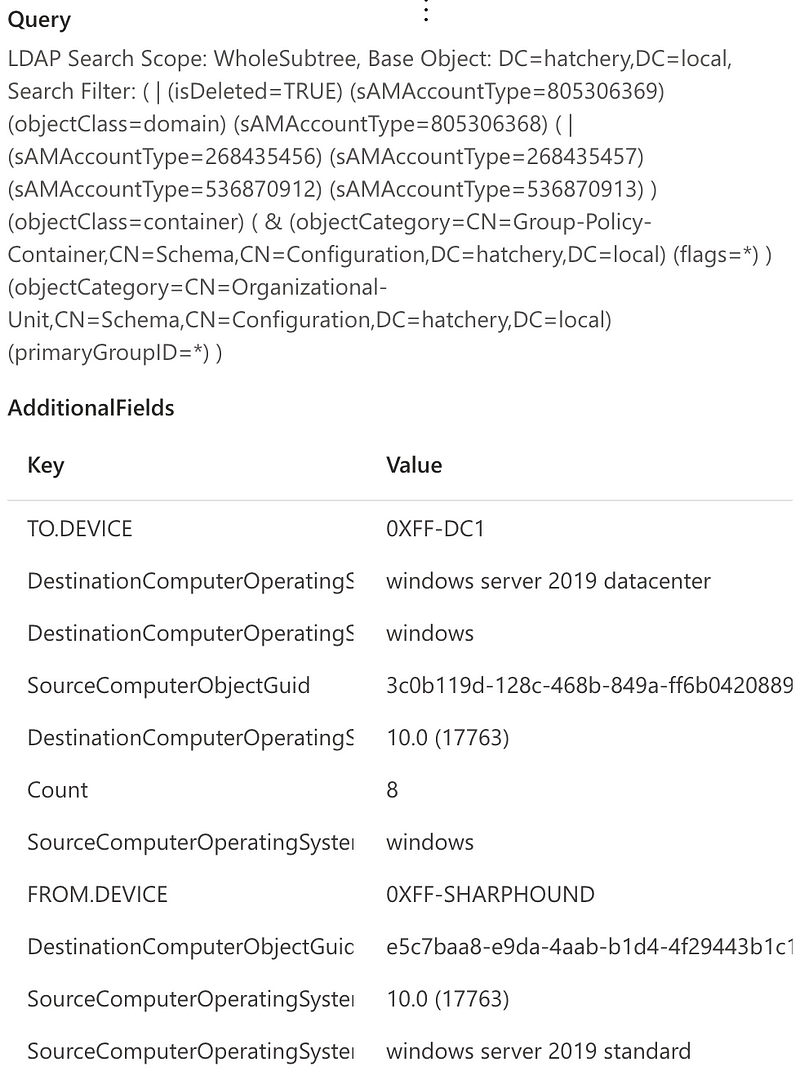
The LDAP search filters are also available from this event in the Query attribute. The collection tools can be detected using the same IoCs obtained before.
The query is available on our Github account.
Below is a list of pros and cons for this way of detecting the technique:
- Pro — Detects attacks on the domain controller side, and does not rely on monitoring of the endpoint from which the attack is executed.
- Con — Depends on IoCs that an attacker might be able to modify by changing the source code of the collection tool.
- Con — Requires Microsoft Defender for Identity to be deployed, which may not be the case in all environments.
- Con — Logging in Microsoft Defender for Identity is sampled, not all LDAP queries are logged. Attackers could be able to bypass detection by mimicking LDAP searches of benign Microsoft tools.
Detection method 3 — Domain controller object access logging via SACLs and audit policies
A third method for detecting collection is using the logs on the domain controller directly to identify which users access a large number of objects in Active Directory. By default, read access to objects in Active Directory is not logged, even when the ‘Directory Service Access’ audit policy is enabled. Read access logging can be enabled by setting an Audit Access Control Entry (ACE) using a System Access Control List (SACL).
In Windows ,a SACL can be used to set up fine-grained access control and auditing on any so called ‘securable object’. Since Active Directory entries are considered ‘securable objects’, an ACE that records access can be attached to them.
A nice resource which provides example ACE entries for SACLs, as well as a tool to programatically configure ACE and SACLs, is available in the Set-AuditRule repository from the OTRF project.
For this detection rule we will add 3 SACLs to log all read access to Users, Computers and Groups in Active Directory.
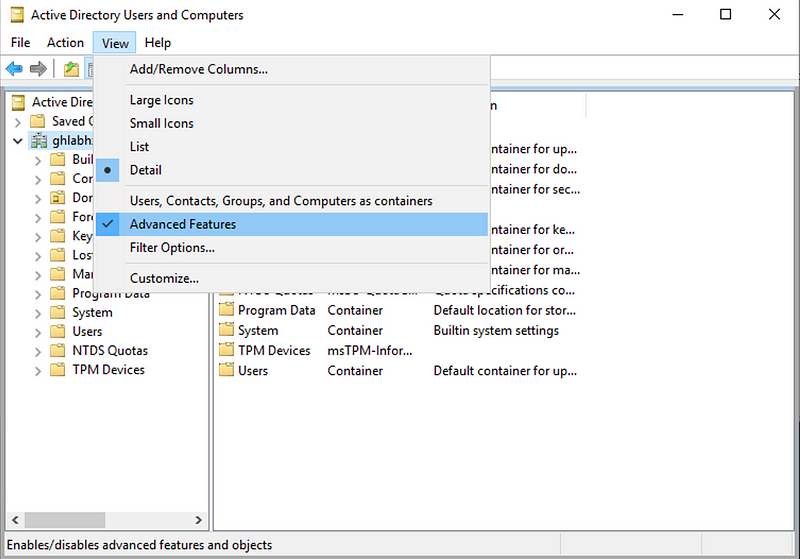
To configure this via the GUI, open “Active Directory Users and Computers” and make sure that “Advanced Features” is enabled under the “View” menu.
Now right click on the Default partition of the Active Directory and select “Properties”, “Security”, “Advanced” and then “Auditing”. This shows the interface where a new Audit ACE can be created.
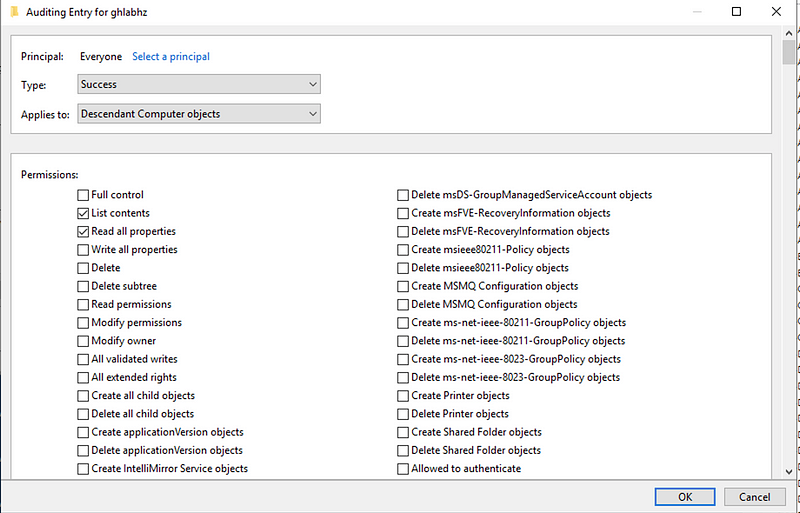
Add an audit entry with the following details:
- Principal: “Everyone”.
- Type: “Success”.
- Applies to: “Descendant Computer objects”.
- Permissions: “List contents” and “Read all properties”.
Repeat this process two more times with:
- Applies to: “Descendant Group objects”.
- Applies to: “Descendant User objects”.
When complete, there should be three Audit ACEs:

From now on, every time anyone reads the properties of a User, Group or Computer object, this will trigger a log entry.
Note that this can cause a significant amount of logging. It is recommended to test these ACEs before enabling them in a production environment. As a rule of thumb, you can expect about 150 events per user per day in your environment. So if you have an environment with 5,000 users you can expect about 750,000 events per day. If this volume is too high, you could consider only applying the ACE to a number of sensitive users/groups such as Domain Admins.
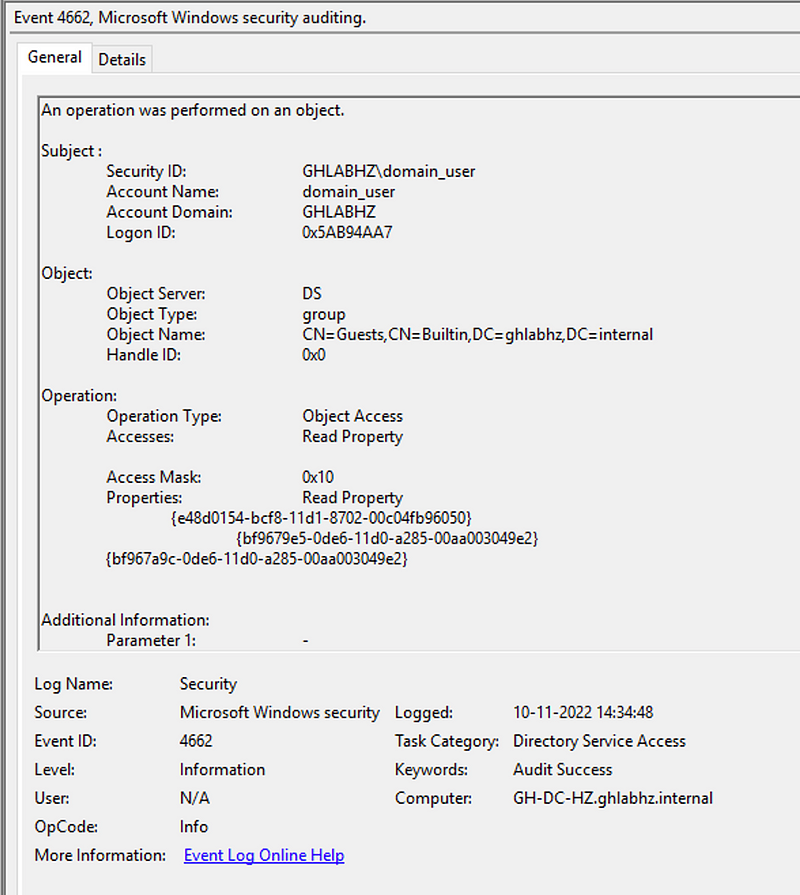
When the SACL for read access to Active Directory is deployed, the event log will show events with EventId 4662 that look as follows:
These logs can be ingested into Sentinel for analysis and will show up in the SecurityEvent table.
To detect large-scale data collection from Active Directory, we can now write a query that looks at the number of 4662 events triggered for objects of type User, Computer and Group, by a specific user, in a given timeframe.
Since there might be users in the organization that need to query large amounts of information from Active Directory, some filtering might be required. One way that we have implemented this rule in the past, is by using a baseline approach where we look at the number of AD objects accessed by a user historically over the last 14 days. When the number of objects accessed on a given day is significantly larger than the historic baseline, an alert is raised.
The query is available on our Github account.
Below is a list of pros and cons for this way of detecting the technique:
- Pro — Detects attacks on the domain controller side, and does not rely on monitoring of the endpoint from which the attack is executed.
- Pro — Does not rely on any tool-specific IoCs; any tool that performs enumeration on a large number of Active Directory objects can be detected using this method.
- Con — Requires a custom SACL to be deployed on all domain controllers.
- Con — Generates a large amount of logging, which can be costly to store and process.
Wrapping up
As mentioned at the start of this post, there are several methods to detect Active Directory data collection. Each method has its own pros and cons; in most cases a combination of these methods would be most successful.
Want to have access to our repository with over 350 advanced detections? Please have a look at our commercial offering and reach out via [email protected].
Knowledge center
Other articles

FalconFriday: Need for Speed: going underground with near-real-time (NRT) rules – 0xFF26
[dsm_breadcrumbs show_home_icon="off" separator_icon="K||divi||400" admin_label="Supreme Breadcrumbs" _builder_version="4.18.0" _module_preset="default" items_font="||||||||" items_text_color="rgba(255,255,255,0.6)" custom_css_main_element="color:...

How data science can boost your detection engineering maintenance and keep you from herding sheep
[dsm_breadcrumbs show_home_icon="off" separator_icon="K||divi||400" admin_label="Supreme Breadcrumbs" _builder_version="4.18.0" _module_preset="default" items_font="||||||||" items_text_color="rgba(255,255,255,0.6)" custom_css_main_element="color:...

Microsoft Defender for Endpoint Internal 0x06 – Custom Collection
[dsm_breadcrumbs show_home_icon="off" separator_icon="K||divi||400" admin_label="Supreme Breadcrumbs" _builder_version="4.18.0" _module_preset="default" items_font="||||||||" items_text_color="rgba(255,255,255,0.6)" custom_css_main_element="color:...

FalconForce realizes ambitions by working closely with its customers in a methodical manner, improving their security in the digital domain.
Energieweg 3
3542 DZ Utrecht
The Netherlands
FalconForce B.V.
[email protected]
(+31) 85 044 93 34
KVK 76682307
BTW NL860745314B01