
Olaf Hartong
In the previous article of this series, I’ve put Microsoft Defender for Endpoint (MDE) next to Sysmon and highlighted some of the differences and attention points in terms of sampling. This time, I want to focus on configuration and telemetry implications.
As we also have established in the previous article of this series, the two primary ways MDE collects telemetry are a) Kernel Callbacks via a driver and b) Event Tracing for Windows (ETW).
On the surface, an MDE deployment looks fairly simple, and it in most cases will be. However, there are some additional configurations that are not all that well documented and will limit the experience and breadth of your detections.
TL;DR: Check your audit policy settings for all of the OUs that are set to system groups where you have MDE deployed. You might have unintentional blind spots and don’t gain the full advantage from your EDR.
Telemetry and Audit Settings
Audit settings I hear you thinking. Yes, for some of its telemetry MDE uses the native event logging via an Event Trace for Windows (ETW) subscription. This is not uncommon for EDRs to do; several vendors do so, since this is quite an efficient and low performance-intensive way of getting certain telemetry. For some EDR vendors this is their primary source of information, as they operate solely in user space. MDE, as described in article 0x01, gathers a substantial bit of its telemetry via kernel callbacks and via other (kernel) driver components. However, a significant number of these are ETW. At the time of writing, there were roughly 111 public and MDE-exclusive providers used.
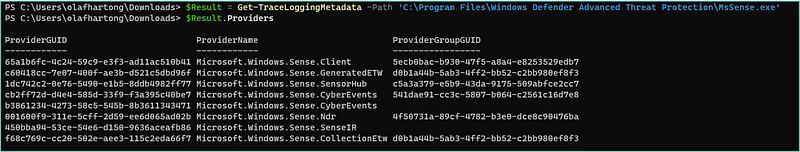
Curious about the traces it utilizes, I had a look at the trace logging metadata with a script created by Matt Graeber.
To see what these providers contained, I fired up Sealighter to trace these providers to a single file for further analysis. Sealighter is highly configurable and can subscribe to multiple providers at once, user and kernel traces. It allows outputs to Stdout, JSON file, or Windows Event Log. While being an amazing tool, it is primarily built for research. If you want to use custom ETW events for monitoring at scale, be prepared for all kinds of interesting challenges with any tool. To my knowledge SilkETW or Velociraptor are probably most suited.
In addition to this, several of these ETW providers are protected. You need to have your tool run as a Protected Process Light (PPL) to get access to these. To access the Microsoft-Windows-Threat-Intelligence provider you also need a Microsoft Early Launch AntiMalware driver (ELAM) which also runs as PPL.
This can be achieved, albeit a bit cumbersome. A great tool for this is PPLRunner and a blog by Patrick Hogan describes how to do this. Using this method is also how my colleague Gijs found a spoofing vulnerability in MDE.
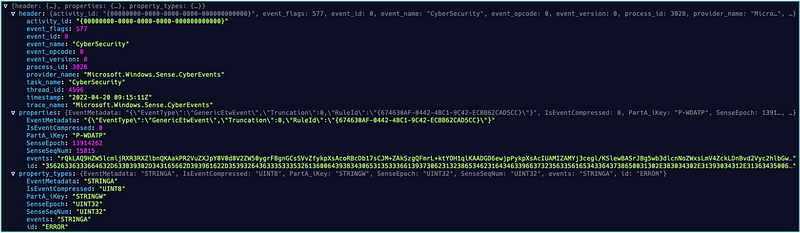
Sealighter, when used to output to a file, will write JSON objects, which makes it easy to parse and even ingest into all kinds of data analytics platforms.
When looking at an object, the events field seems to be populated with what looks like a base64 encoded string. When I decoded it, the following output was visible.
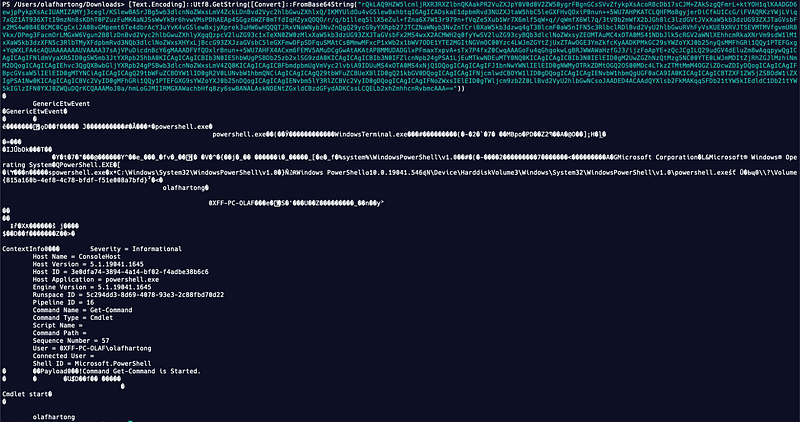
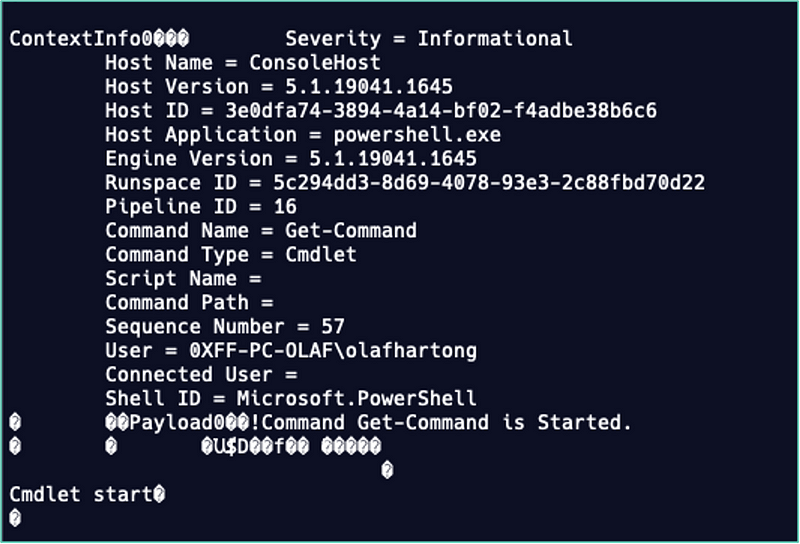
There is a bit of seemingly binary data and at the bottom a more familiar and mostly legible text blob, which looks a lot like a PowerShell EventLog event.
The binary data is in fact serialized with Bond. Bond is a cross-platform framework for working with schematized data. It supports cross-language (de-)serialization and powerful generic mechanisms for efficiently manipulating data. As stated on the git project page, Bond is broadly used at Microsoft in most of their services, evidently at least in MDE.
So far I have not found the schemas for these streams, but honestly I had no immediate need for them either. Just curiosity.
Next question is where is that data is coming from. It clearly looks like PowerShell event logging.
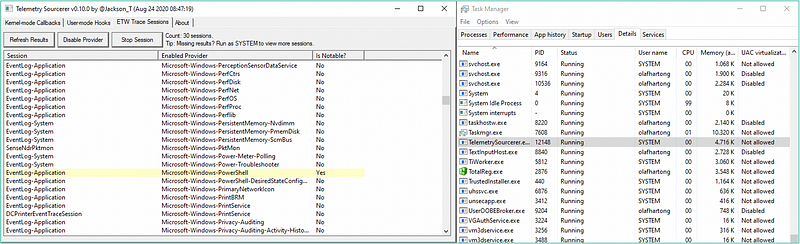
When investigating the ETW subscriptions via the excellent TelemetrySourcerer tool, there was no subscription to the provider for anything else than the EventLog-Application, so is MDE also utilising the EventLog?
Like any product, MDE also requires a configuration to know what to log. This configuration is maintained by Microsoft and is downloaded from the internet on a regular basis. It is stored any onboarded box, in a non-clear text format. Additionally, it is signed and not easily tampered with. The exact details are up to you to find out. 😉 (sorry, not sorry)
Some details of the config entail;
- ~ 70k lines of JSON.
- ~ 65 ETW providers utilized.
- ~ 500 registry paths monitored.
- ~ 60 data collection commands that fire frequently.
- Different settings for high-latency environments and a lot more.
A small excerpt of the 65 ETW providers also shows that PowerShell one we’ve seen earlier.
Powershell cmdlets
Microsoft-Windows-Kernel-Audit-API-Calls
Microsoft-Antimalware-Service
Microsoft-Windows-ThreatIntelligence
Microsoft-Windows-Win32k
Microsoft.Windows.Oct.Enclave
Microsoft-Windows-Audit-CVE
Microsoft.Windows.Defender
Microsoft-Windows-Win32
SecureETW
The last one peeked my interest, so I wanted to learn more about it. Besides the self-proclaimed names, the configuration also holds the GUIDs of the providers it is tracing. This allows us to understand more about the actual origin of the trace.
The Provider GUID {54849625–5478–4994-A5BA-3E3B0328C30D} which MDE calls SecureETW in its configuration can relatively easily be resolved on any Windows machine with the logman utility, which is part of the native Windows tools.
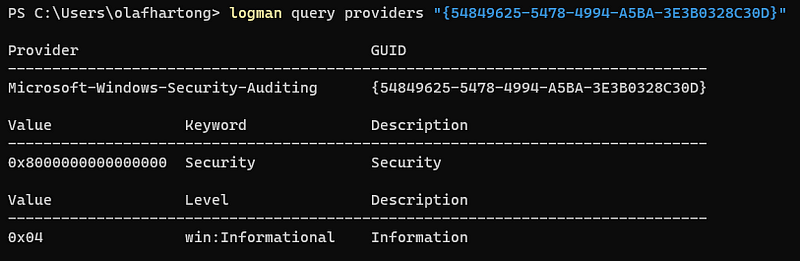
This provider is more commonly known as the Security log (Microsoft-Windows-Security-Auditing), which gets its information primarily from the kernel and the logging is populated to the event log via the Windows event log service (c:\Windows\System32\wevtsvc.dll) that subscribes to this provider.
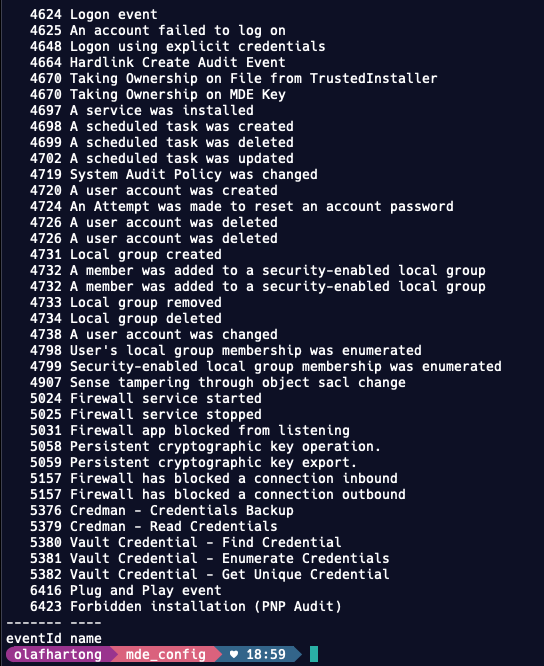
So we can safely conclude that MDE actually does look at EventLogs. When we start digging into which events MDE uses for telemetry from this specific provider, there are 38 Event IDs it is configured to listen for.
Not every Event ID is logged by default on a Windows machine, some require to be enabled by the (Advanced) Security audit policies.
Per audit setting there are 3 levels to configure or leave it unset. These settings determine what Event IDs get logged and in for what result. The levels are: Success (1), Failure (2), Success and Failure (3) and No Auditing (0).
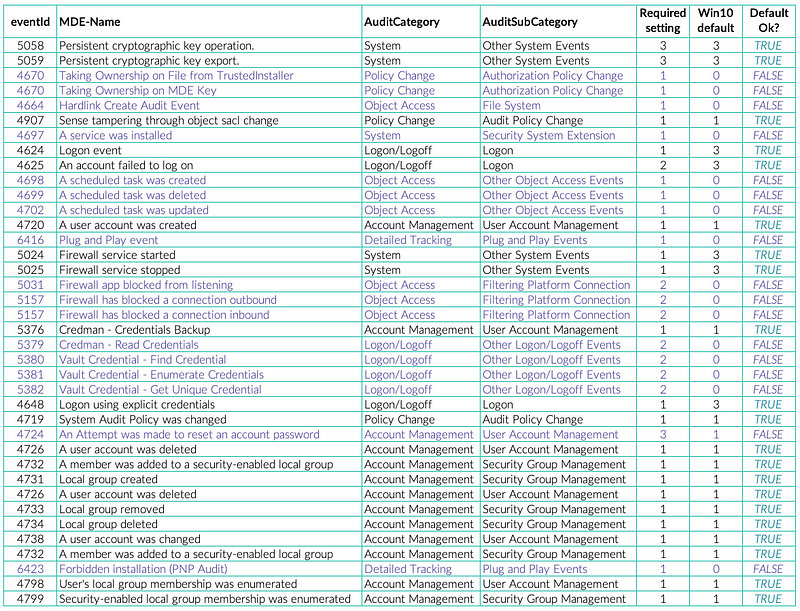
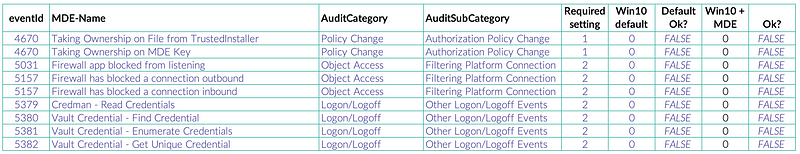
When we look at the required audit settings for each Event ID to generate the telemetry that MDE is utilizing, and compare that with the Windows 10 default, there are quite a few that will not generate telemetry without a configuration change.
When you’re not using the optimal audit settings your EDR will have blind spots for some of the events it requires for its detection and response capabilities.
I’ve not been able to locate any documentation for these events on the Microsoft website. Right after publication of this article, a friendly Microsoft employee referred to the documentation for the firewall events, the rest of the events seem to not be documented yet.
The MDE team is aware of this and made some effort to support people that don’t have the proper audit settings enabled. They will enable some of these settings for you on install. They are deliberately conservative here, the ones enabled are the ones that don’t generally produce a lot of telemetry and therefore have little impact to the machines and potentially ingested data volume to a central logging solution. Sadly, at the time of writing this there is no official documentation on this subject.
Keep in mind that these settings will be overwritten by your group policy if you push something else. Therefore, it’s not guaranteed that these settings remain enabled. By default, if there is no setting in the GPO, it will remain unchanged. Make sure to check what you have configured in your policies. A helpful script is posted below.
Microsoft publishes a security baseline. Part of this baseline is a set of recommended audit policy settings. This baseline is not necessarily the best one to fully apply, Microsoft also recommends to review this before applying. One of the other popular policies is the one created by Michael Gough who maintains the malwarearchology website.
Both might still miss events. Though they are great, make sure to enable all that is important to you and your detection strategy.
Policy checker script
You might have dozens of group policies applied in your environment, which in turn are linked to several Organisational Units(OUs). To easily assess your settings, I’ve built a crude and simple script to get all group policies, look for the ones with audit settings and check whether all by MDE-required settings have been applied. Where there are some missing, it’ll let you know which ones have not been set.
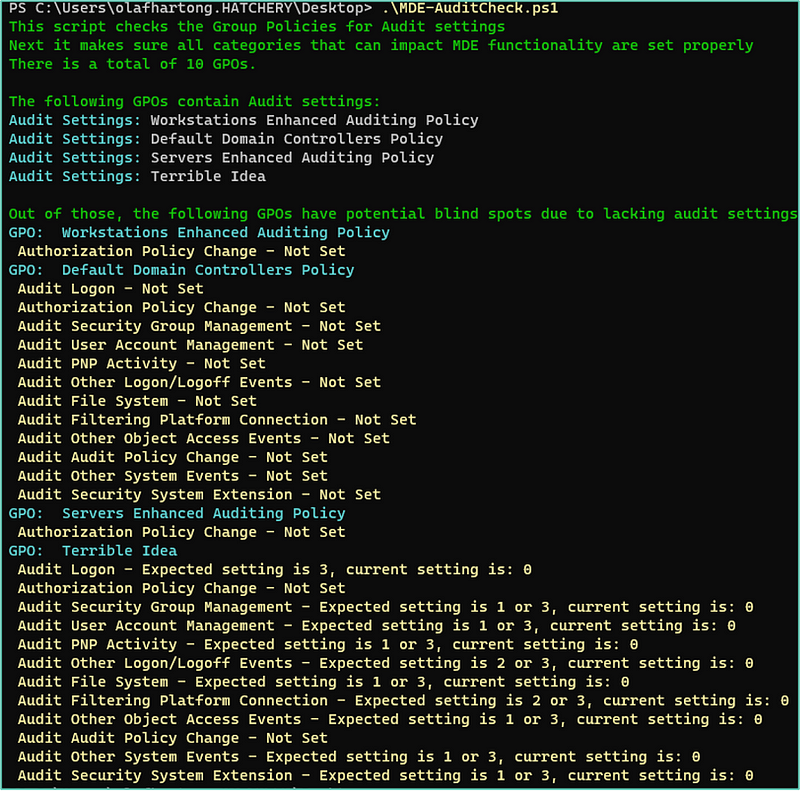
This script is available here.
Like I’ve mentioned above, enabling these settings will grant you optimal visibility within MDE. However, now they are enabled, some of the events that will be generated can be quite voluminous. Therefore, before you enable them there are some things to consider:
Forensic Analysis / Local log retention — When the volume of data generated is bigger, this also requires a large enough EventLog size setting to have enough local log retention for analysis of incidents when required. Ideally, this should be able to contain several days to weeks of data. Make sure to set this to a proper size; the default is a minuscule 20MB on a Windows 10 machine, 1GB is a minimum recommendation.
SIEM / Central data analysis solution— Obviously, for similar reasons as above, this volume increase will also impact your central data analysis solution. Since most of them work on a data volume model in terms of pricing, you need to either be prepared for this or make sure to filter the ingested data on some level.
The rest of the articles in this series on MDE is available here.
Knowledge center
Other articles

FalconFriday: Need for Speed: going underground with near-real-time (NRT) rules – 0xFF26
[dsm_breadcrumbs show_home_icon="off" separator_icon="K||divi||400" admin_label="Supreme Breadcrumbs" _builder_version="4.18.0" _module_preset="default" items_font="||||||||" items_text_color="rgba(255,255,255,0.6)" custom_css_main_element="color:...

How data science can boost your detection engineering maintenance and keep you from herding sheep
[dsm_breadcrumbs show_home_icon="off" separator_icon="K||divi||400" admin_label="Supreme Breadcrumbs" _builder_version="4.18.0" _module_preset="default" items_font="||||||||" items_text_color="rgba(255,255,255,0.6)" custom_css_main_element="color:...

Microsoft Defender for Endpoint Internal 0x06 – Custom Collection
[dsm_breadcrumbs show_home_icon="off" separator_icon="K||divi||400" admin_label="Supreme Breadcrumbs" _builder_version="4.18.0" _module_preset="default" items_font="||||||||" items_text_color="rgba(255,255,255,0.6)" custom_css_main_element="color:...

FalconForce realizes ambitions by working closely with its customers in a methodical manner, improving their security in the digital domain.
Energieweg 3
3542 DZ Utrecht
The Netherlands
FalconForce B.V.
[email protected]
(+31) 85 044 93 34
KVK 76682307
BTW NL860745314B01