
Olaf Hartong
In part one and part two of this series, we have established that Microsoft Defender for Endpoint (MDE) uses sampling and caps on events to limit the amount of telemetry being uploaded to the cloud. If you have not read these two posts, please take some time to go through them to get more context on what is described within this article.
There probably are many reasons why Microsoft has decided on this design of limiting the amount of telemetry that ends up in the portal. The primary ones I can think of are bandwidth consumption, expected usage, performance (on the cloud side) and likely the most dominant one: cost.
Since MDE is a fixed-fee solution and Microsoft has shareholders that want to get some return on their investments, this can’t be a limitless philanthropic service. Therefore, Microsoft needs to apply some mechanisms to have a predictable maximum set of telemetry per onboarded device.
One thing that we noticed when supporting our clients, is that a predominant part of them did not utilize the search and custom detection capabilities prior to getting us to support them. Assuming this applies to a large portion of the Microsoft customer base, this might also add to some of the aforementioned design decisions.
To be very clear, the sampling and caps are applied as defined in the MDE configuration, which is maintained by Microsoft. These logs are shipped to a log analytics-like workspace in your tenant, which you can partially access via the M365 Defender portal. I deliberately state ‘partially’, because not all telemetry seems to be exposed to us as users. In some cases this is because some of the components are still in preview or the data is used only for EDR detections. It can also be the case this telemetry is not deemed valuable for us, the users of this service.
Telemetry capping
As mentioned before, a lot of the events have a local cap of 1 per 24 hours that get forwarded to the cloud, based on a set of distinct field values. For instance, the following configuration item from the Microsoft-Windows-TCPIP provider for the Connect Complete event:
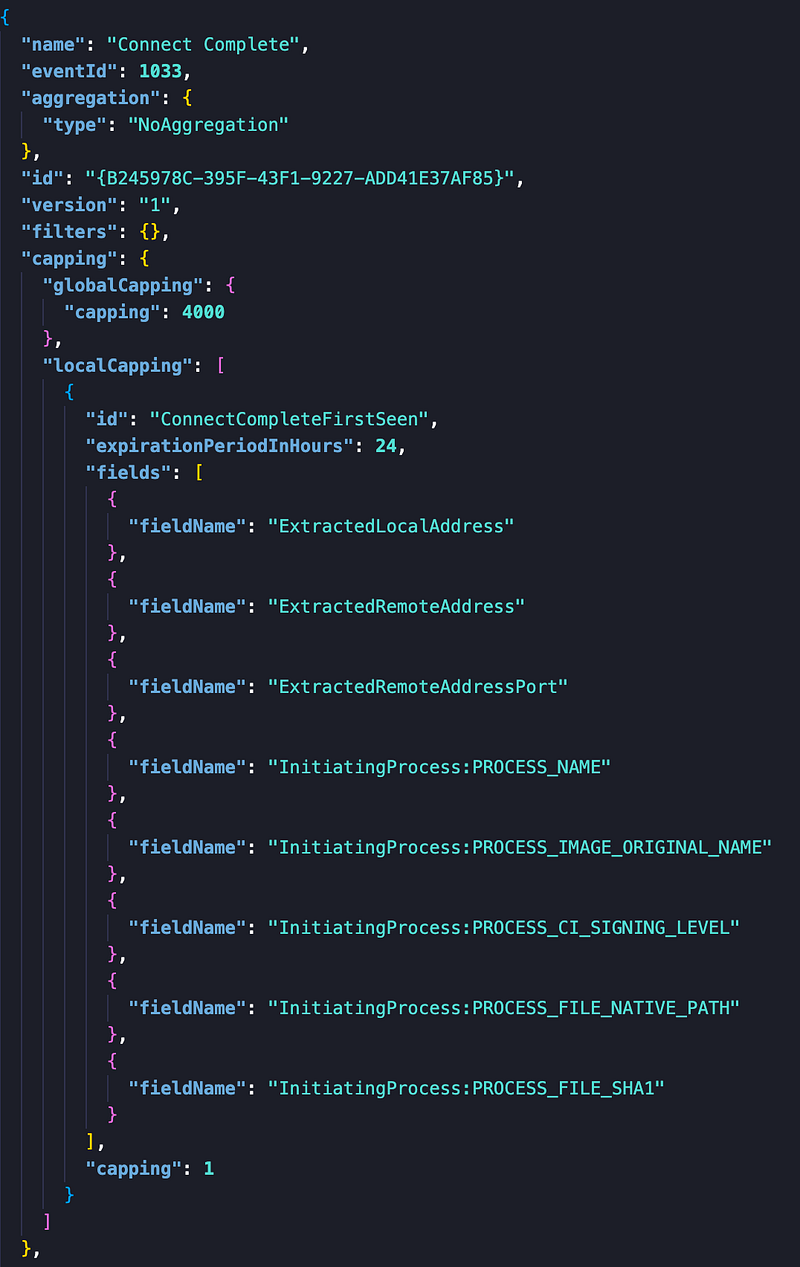
This configuration shows that it will generate a ‘first seen event’ for each connection for which all of the visible fieldNames are unique as a set. Should one field value change, a new event is generated. All distinct sets expire in 24 hours and there is a total limit of 4000 distinct events in this timeframe.
Please note that the configuration applies to the EDR sensor telemetry component. There are components that, for instance, are part of the AV that can augment this log with additional events, should the process be flagged as suspicious.
Depending on how you want to utilise this telemetry it is not great or it might be enough for you. Regardless, it is at least predictable and to that extent reliable — to a certain level.
Telemetry unpredictability
Sadly, this is not applicable to all event types. In particular, the ImageLoadEvents, or in other terms DLL load events. To this date I have not been able to find an explanation for how this telemetry is sampled, which it most definitely is, heavily. My current rationale, which I have a hard time accepting, is that it is completely random, or at least I perceive it as such.
This makes the DeviceImageLoadEvents table very unreliable. No events in the portal does not mean nothing has happened on the box.
When running the exact same set of processes on multiple machines in several enterprise environments, not only the number of DLL load logs differ per machine (for the same process); also it differs per machine over time. So logs that show up today might look different tomorrow.
So far, we’ve only found this to be the case on the ImageLoadEvents, and all others follow the cap-based filtering, which is acceptable in most cases. So when building detections this should be factored in. Since the event not being there does not imply it did not happen at all that day, can’t make it a required fact in a detection; it should at best be an optional one.
This never sat well with me and I wanted to figure out a way to improve this. Obviously, augmentation via Sysmon could be an option, but this can prove to be complicated at scale, rolling it out, ingesting the logs and correlation with MDE data in another platform. While this is still better and more complete than the solution provided below, it is not for everyone due to the additional requirements.
‘Custom’ telemetry augmentation
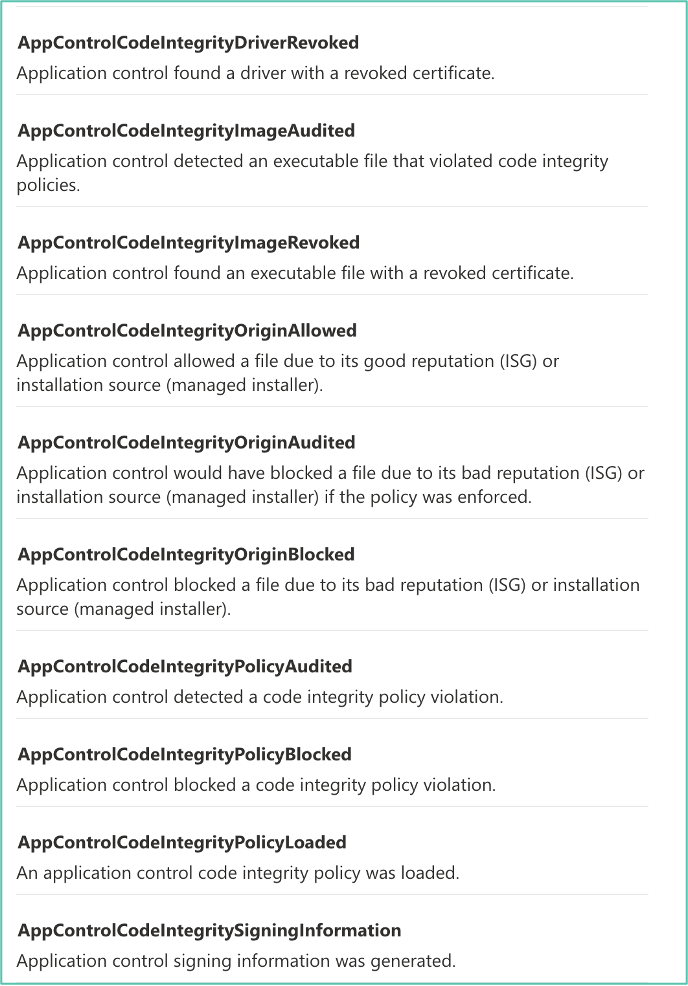
During some distantly related research into the capabilities of the Windows-native feature Windows Defender Application Control (WDAC), I noticed that these events were also ingested by MDE and exposed in the DeviceEvents table as a set of ActionTypes.
So I thought: why not create an audit-only policy for the files which I want make sure are logged when they are used by a binary?
If you want to learn more on how to use WDAC to its full capabilities, there is a set of great blog posts by Matt Graeber on this subject. To deploy this at scale, Microsoft also has some good documentation. Soon, there also will be proper support in Intune as well.
The great thing about WDAC is that you can choose to deploy a configuration in audit mode. It will only log and not interfere. Should you already have a WDAC configuration running — in which case I applaud you — you can go into two directions. If this also is an audit policy you can merge it into one, or you can decide to add the one I’m sharing below as a supplemental policy. This also works when your current base policy is an Enforcement (blocking) policy; they can be used together, which is pretty amazing.
Ideally, when you implement this and you’re a bit familiar with the process, I would recommend you signing the policy file to prevent someone from tampering with it.
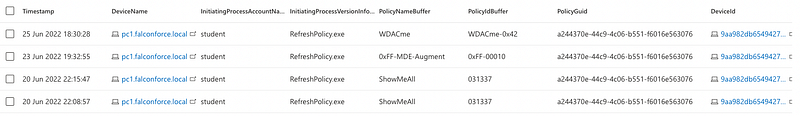
At a minimum, monitor for policy changes, as this might indicate tampering as well. A sample query to get you started with monitoring changes can be seen below.
DeviceEvents
| where ActionType == "AppControlCodeIntegrityPolicyLoaded"
| extend AddFields=parse_json(AdditionalFields)
| extend PolicyGuid=toguid(AddFields.PolicyGuid), PolicyIdBuffer=tostring(AddFields.PolicyIdBuffer), PolicyNameBuffer=tostring(AddFields.PolicyNameBuffer)
| project-reorder Timestamp,DeviceName,InitiatingProcessAccountName,InitiatingProcessVersionInfoOriginalFileName,PolicyNameBuffer,PolicyIdBuffer,PolicyGuid
WDACme repository
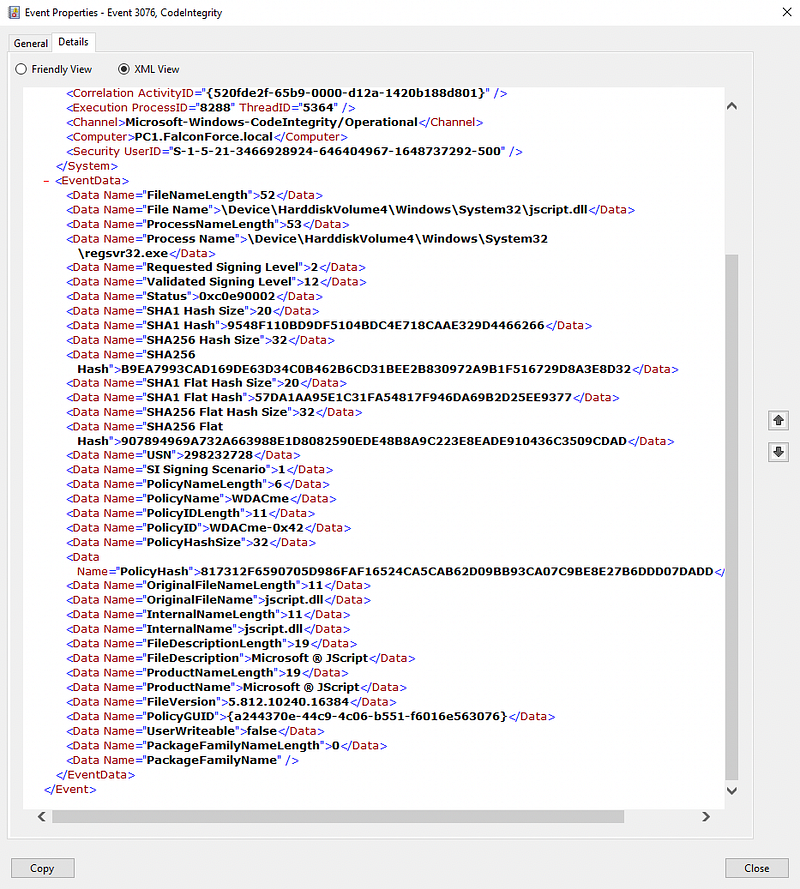
The WDACme project contains a configuration to make sure there is telemetry for the binaries I always want to know about and only audits them. This data shows up in the Microsoft-Windows-CodeIntegrity Eventlog. These events contain a wealth of metadata.
MDE also logs these events to the DeviceEvents table and exposes them in the ActionType AppControlCodeIntegrityPolicyAudited and can, for instance, be found with the following query:
DeviceEvents
| where ActionType == "AppControlCodeIntegrityPolicyAudited"
Please note: while this sounds great and it is pretty nice (if I say so myself), the capping filter will also apply here. So, we will receive telemetry for every first-seen event in 24 hours. So it will not be excellent for all goals. However, it is a huge improvement over the current random telemetry feed in the ImageLoadEvents, with little effort and no real impact to the telemetry acquisition flow.
You can find this configuration in XML and deployable CodeIntegrityPolicy (CIP) binary format here.
Since we now can be relatively certain we at least have one unique event per day, we can use them in correlation searches. Another thing we can do is start building baselines for certain known processes loading certain DLLs from a specific path and possibly even with a certain CommandLine.
Now you could for instance do this for unexpected .NET processes, since these are known to load a certain set of DLLs, being: clr.dll, clrjit.dll, mscoreei.dll, mscoree.dll, mscoreeis.dll, mscorlib.dll, or mscorlib.ni.dll.
After filtering some known processes and their respective starting folders only the outliers remain.
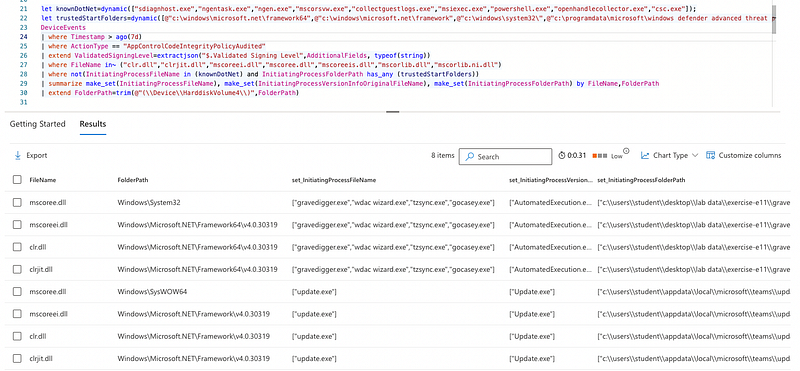
This is just one of the many examples of what can be done now. Also, for instance, Word loading the VBA DLLs (because it contains a macro) will be visible.
Please give it a go, the repository is most definitely not complete, so pull requests are most welcome!
Modifying and regenerating the policy
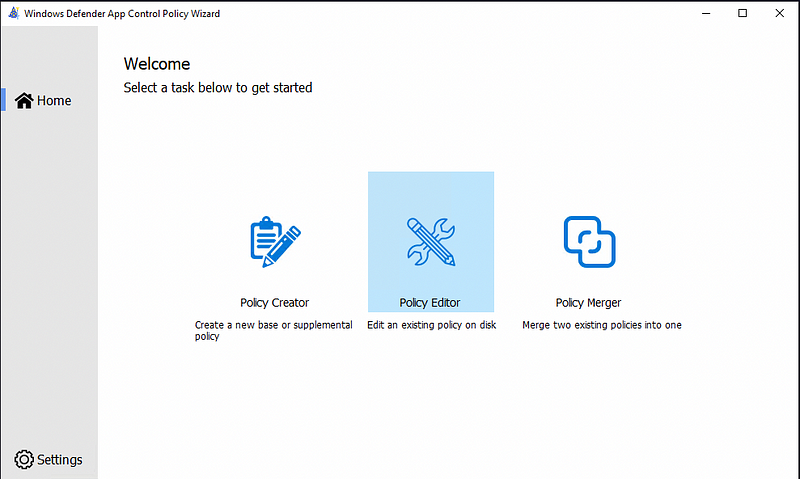
Whenever you have updated or modified the policy XML file you need to generate a new binary file to be able to load it. This can be done with the scripts shared by Matt in his blog posts or with the WDAC Policy Wizard.
One you’ve installed and opened the wizard you choose the Policy Editor option.
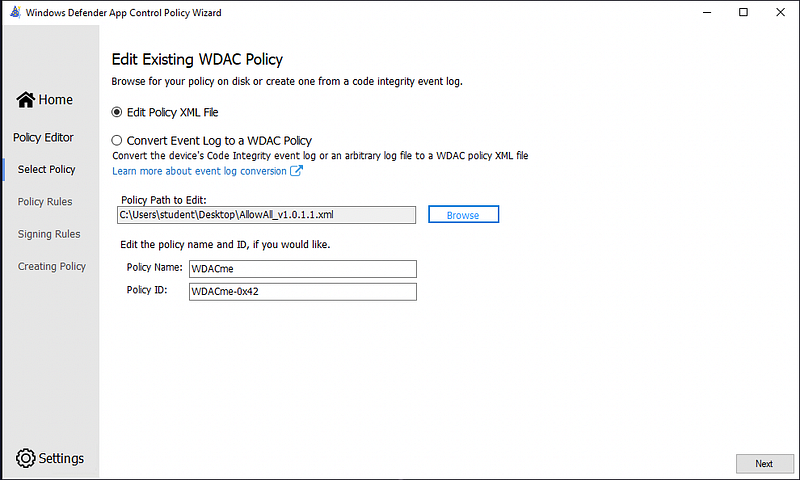
Next, you load the modified policy.
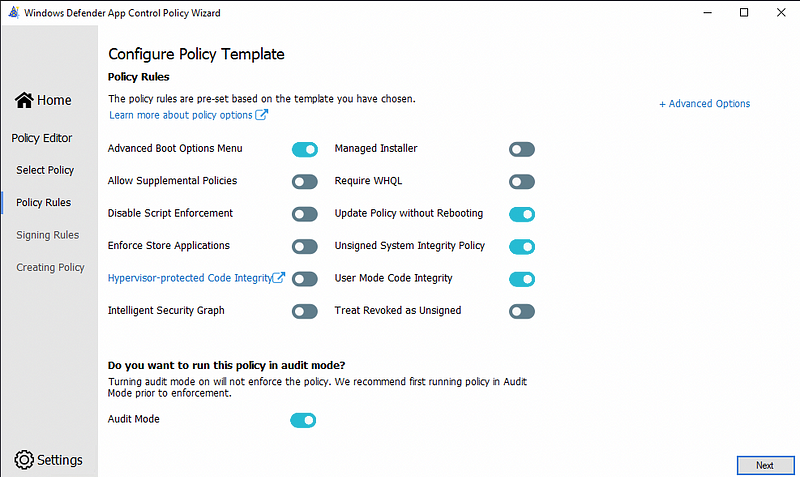
Then you get a lot of options that are out of scope for this blog and you can safely continue.
On the next screen you get a rule editor. You can also add and remove rules here but I don’t find this interface very nice to work with. I prefer to edit the XML file to have a more granular control over the rules.
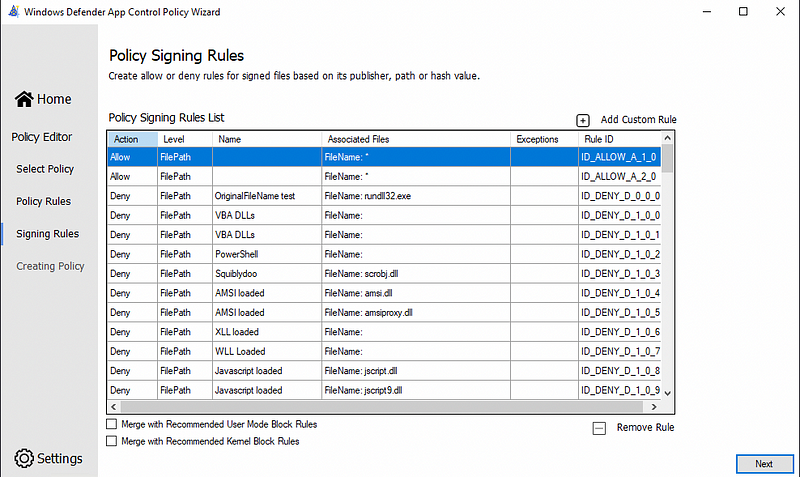
Once you click next, it will start generating the binary CIP file you can deploy.
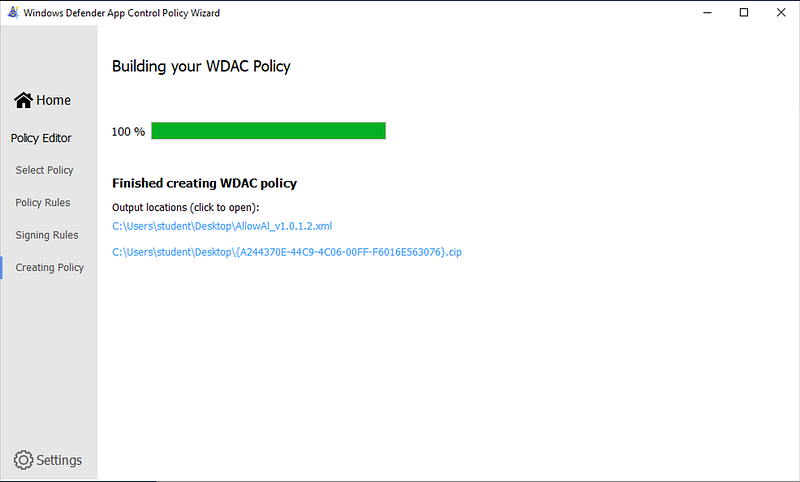
One issue with this wizard is that if you have made errors in your XML file, the wizard will not really tell you. The only clear hint when there is something wrong with your configuration is that it will tell you it generated a .bin file and there is nothing written to disk once you check that location.
v
For the automation fans there is also an excellent set of PowerShell tools, again created by Matt Graeber. This allows you to generate a config, create new modules and much more. Best of all, there also is great error handling in there, which allows you to quickly fix them.
When it succeeds, it will write the new CIP file to the default BuildArtifacts folder, allowing you to embed this whole process into an automation pipeline.

One of the other cool features of this tool is that is can also convert a binary CIP file back to a modifiable XML file, in case you lost the original file. Obviously, there are also interesting use cases imaginable for the offensively oriented people here.
Happy detecting!
The rest of the articles in this series on MDE is available here.
Knowledge center
Other articles

FalconFriday: Need for Speed: going underground with near-real-time (NRT) rules – 0xFF26
[dsm_breadcrumbs show_home_icon="off" separator_icon="K||divi||400" admin_label="Supreme Breadcrumbs" _builder_version="4.18.0" _module_preset="default" items_font="||||||||" items_text_color="rgba(255,255,255,0.6)" custom_css_main_element="color:...

How data science can boost your detection engineering maintenance and keep you from herding sheep
[dsm_breadcrumbs show_home_icon="off" separator_icon="K||divi||400" admin_label="Supreme Breadcrumbs" _builder_version="4.18.0" _module_preset="default" items_font="||||||||" items_text_color="rgba(255,255,255,0.6)" custom_css_main_element="color:...

Microsoft Defender for Endpoint Internal 0x06 – Custom Collection
[dsm_breadcrumbs show_home_icon="off" separator_icon="K||divi||400" admin_label="Supreme Breadcrumbs" _builder_version="4.18.0" _module_preset="default" items_font="||||||||" items_text_color="rgba(255,255,255,0.6)" custom_css_main_element="color:...

FalconForce realizes ambitions by working closely with its customers in a methodical manner, improving their security in the digital domain.
Energieweg 3
3542 DZ Utrecht
The Netherlands
FalconForce B.V.
[email protected]
(+31) 85 044 93 34
KVK 76682307
BTW NL860745314B01