This blog has been in draft for quite some time and for no particular reason it was never published. A recent tweet rekindled my desire to share more details about our learnings in working with MDE at large scale for many clients.
In previous blogs in this series I’ve spoken about how MDE get its telemetry and how it stacks up against Sysmon. Which audit settings it relies on and which — if not configured correctly – might give you blind spots. And lastly, the telemetry unreliability and log augmentation suggestions.
In this edition we remain on the telemetry topic, specifically regarding the Timeline feature of the MDE. One of the immediate differences between the Timeline and the raw telemetry that is available through the Advanced Hunting tab, is that this data is stored for 180 days, where the raw logs are only available for 30 days, after which they are removed from the M365 portal. It is possible to retain them outside of the M356 portal, which is pretty well documented by Microsoft and out of scope for this blog post.
The Timeline
The Timeline can be found for any device in the M356 portal. It holds all kinds of events that have happened on a device.
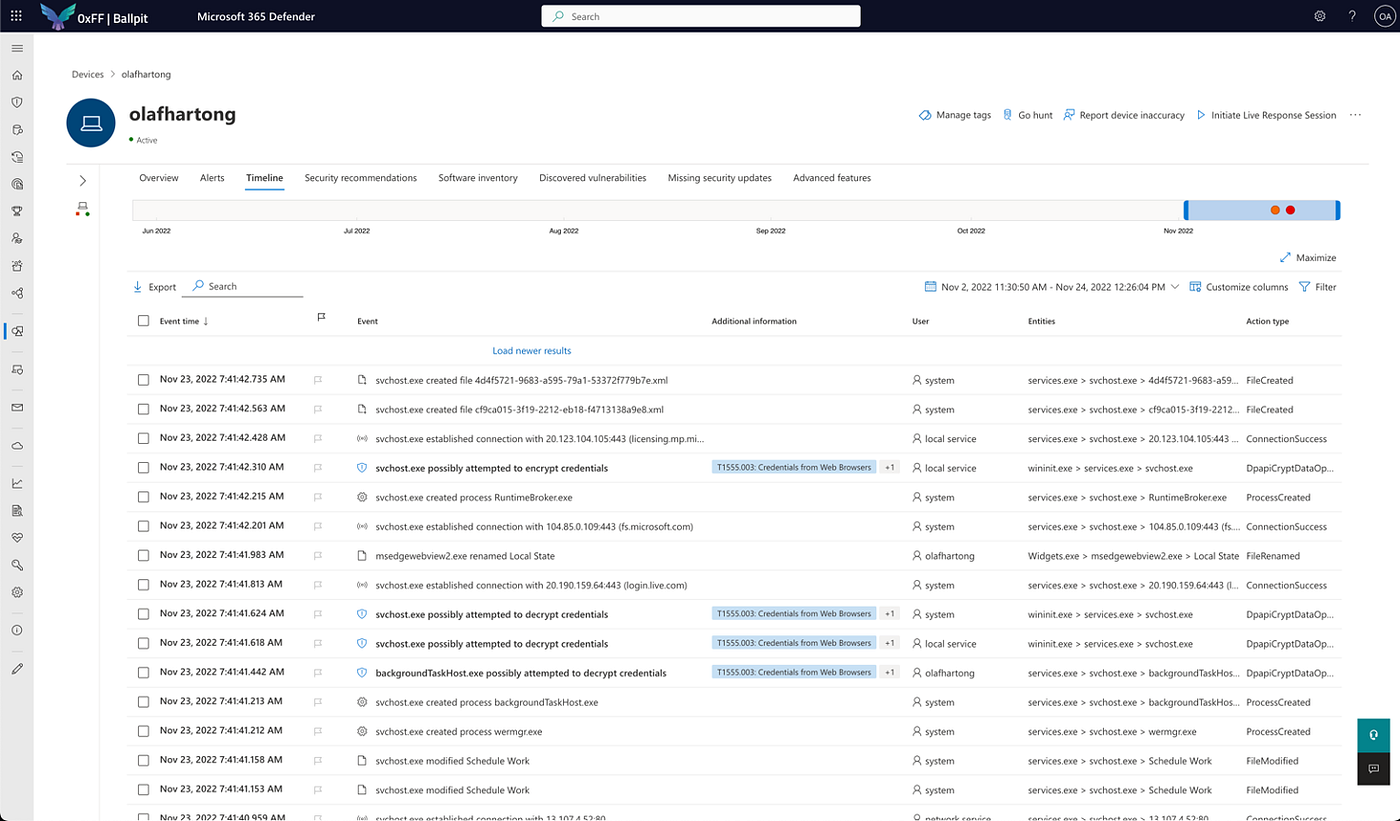
While scrolling through this page we see quite some events that are tagged with MITRE ATT&CK techniques. This is just additional information in most cases and not meant as indication of an attack. Also this information is not searchable in the same way as we are used to in the “Advanced hunting” tab. The search in the Timeline is in fact a quite terrible experience. Additionally, the loading of new data while scrolling down isn’t very snappy at all. I already mentioned the search right?
Whilst I didn’t open the Timeline too often, I regularly see others using it. Talking to analysts at several clients I also learnt it is quite frequently used. Scrolling through these pages of information, some things immediately stood out to me. There are far less events in there than actually happened on the machine. However, there are also a lot of events that are different from what is available in the Advanced hunting tab, these events can be used for hunting and custom detections. Since that last part can be used in a proactive way, instead of very manually scrolling after something (might have) happened, I was interested in some more factual base to be able to claim there is a difference in telemetry.
Getting more data
Since I wanted to be able to compare the data available on the Timeline page to what I can query in the Advanced hunting tab, I needed to get an export of the Timeline data. The GUI has a button to export the data in the selected timeframe to an Excel file, but I didn’t want that since it does not scale well. Next, I opened up the developer tools and quickly found that the website serves you a nice JSON blob.

After copying it into VSCode and prettifying it to make it more readable, it showed a remarkable level of detail.

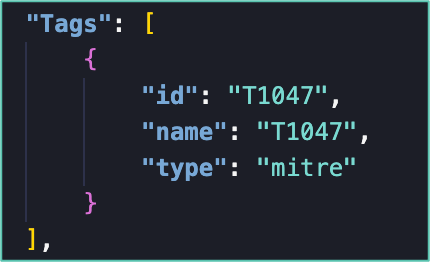
As you see, there is a lot of (correlated) data here, which is quite nice for a quick-glance investigation of events on the host. The ActionType field immediately stood out to me and a lot of the events have a familiar name, like they also do in the raw events. Added to that, there are, for example, some MITRE informational tags to techniques, whether it should be a bold event in the interface (signalling importance) and some more type and hidden details.
OneCyber
Also, there is the IsCyberData field, which is a boolean field that is set to true or false. Since this was something unfamiliar to me, I immediately wanted to learn more about it. When filtering these events for only the IsCyberData set to true, the ActionType was always OneCyber, which I never had seen before.

The HiddenDetails of these events show some more information about the tagged ATT&CK techniques. The RelatedObservation field has an ActionType-like value that indicates the event type.

This is where the TypeDetails information becomes also very interesting and has a lot more details about that event.
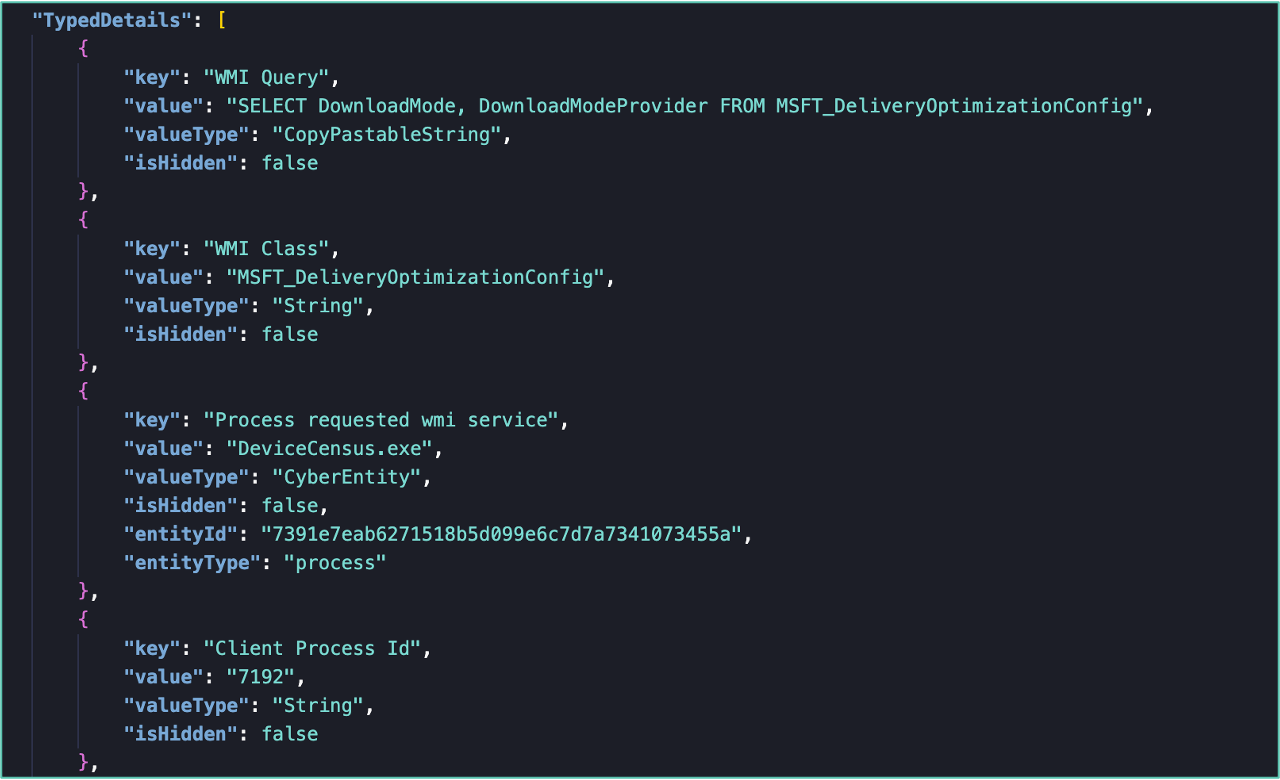
For the people who are familiar with the data available to hunt and build custom detections, this data immediately stands out as all new events. While you might get excited about this treasure trove of (possibly) unknown and unavailable information, sadly, at this time, it is also fairly unobtainable. I’ll come back to this to in the next chapter.
Obtaining more data
Since there is no documentation on the collected events, nor is there a data schema available, I have to validate what I see. So far, I was doing the analysis on the telemetry of a single lab machine and I realized I needed to scale up. I found that the Timeline UI only asks for a 100 events at a time. With some fiddling with the request headers I got this up to a 1000 events, which still was not that much. So, I decided to write a small script that could get those JSON events from the API, but that turned out to be not too trivial. Sure, I’m not the best coder (which doesn’t help). But Microsoft also protects these APIs, which are not intended for programmatic access, with an API proxy (https://security.microsoft.com/apiproxy/mtp/detectionDeviceTimeline/machines) — which made getting data from it a bit tedious. Fortunately, my colleague Gijs Hollestelle helped me out and found a way around that proxy and build me a nice python script that allowed me to specify how many events and how far back I wanted to collect. Next, I wanted to get a good and broad data set, so I decided to collect several weeks of data for 10.000 machines, which took a loooong time.

The events had to be collected at a 1000 events per machine per API call. Moreover, the database (as described above) is quite slow. So this collection process took almost two days. Since this API service is not intended for this type of (ab)use and it’s already straining to be responsive, it does not seem like a great idea to open-source our script.
My initial hope of getting the data out this way (and fed it into Microsoft Sentinel automatically to use for threat detection) also evaporated with this experience at scale. I do still see use for an automated function which is triggered on an incident on a host and which collect this information for additional, queryable, contextual information.
Analyzing the collected data
Since I like working with the Kusto query language, I wanted to use it for this fairly large collected data set. Since this investigation on the collected data set is a sort of single-use purpose, it didn’t make sense to me to stream it into Sentinel. One of the cool things Microsoft also offers is a free Data Explorer instance for projects like this (also great for smaller IR-like projects). There are some limitations, but perfectly fine for what I wanted to do with it.

After building a schema to ingest all this data into, I started looking at all of the OneCyber events for these 10k machines, which were recorded in the timeframe I was able to extract. This also means it is quite likely that all findings below are not complete. There might be more events I did not encounter in my sizeable, yet still a sample, set.
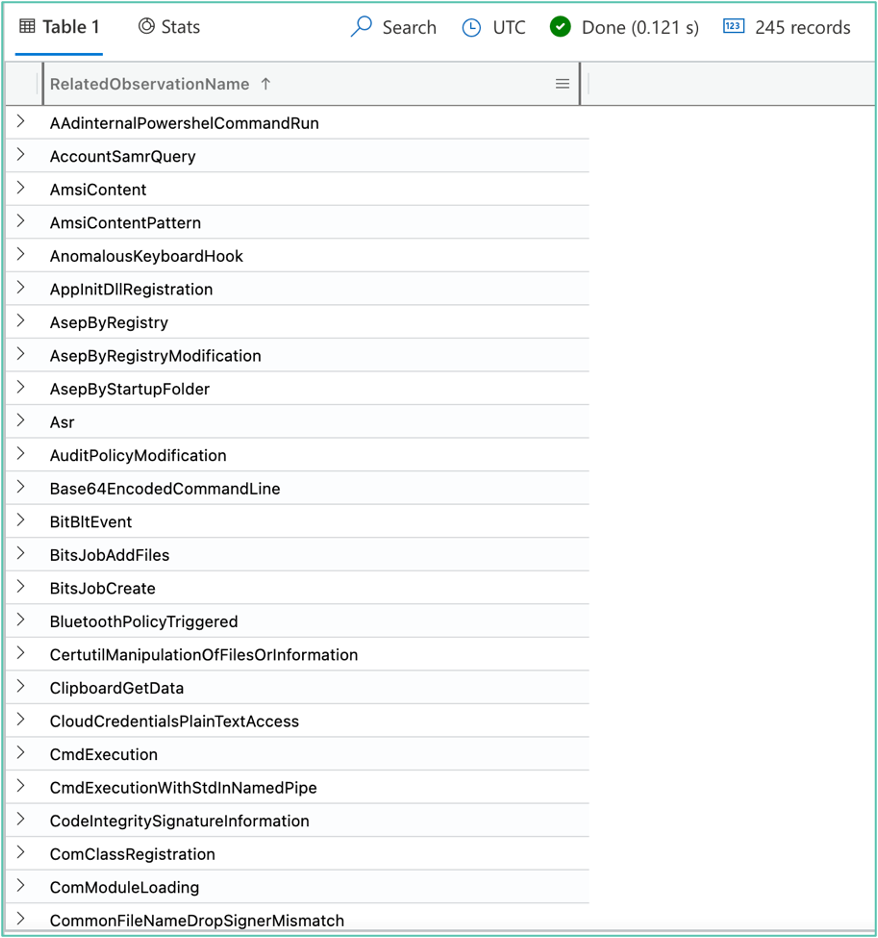
There were 245 distinct observation types in this set. Since I wanted to find out which events are missing in the Advanced Hunting telemetry, I needed to figure out what was what.
So, I decided to tag all types with the one of the following options:
- Available in ‘Advanced Hunting’.
- Rule based, possible to replicate in ‘Advanced Hunting’.
- Partially available in ‘Advanced Hunting’.
- Not available in ‘Advanced Hunting’.
My process was to look at the details of each of the 245 events, go through the raw events for that same machine in that timeframe in the Advanced Hunting tab and determine whether whether that same data could be gathered there. Either directly, or by building a custom correlation rule — like also seems to happen in the background for the Timeline events.
After some hours of digging through the data and de-conflicting some of the correlated events in Excel, I collected examples, comments and descriptions on the events I could not replicate or explain.
After wrapping up my analysis, I found 61 event types for which there is no or limited queryable telemetry in the Advanced Hunting tab. If you are interested: there is a CSV list of all events at the bottom of this post.
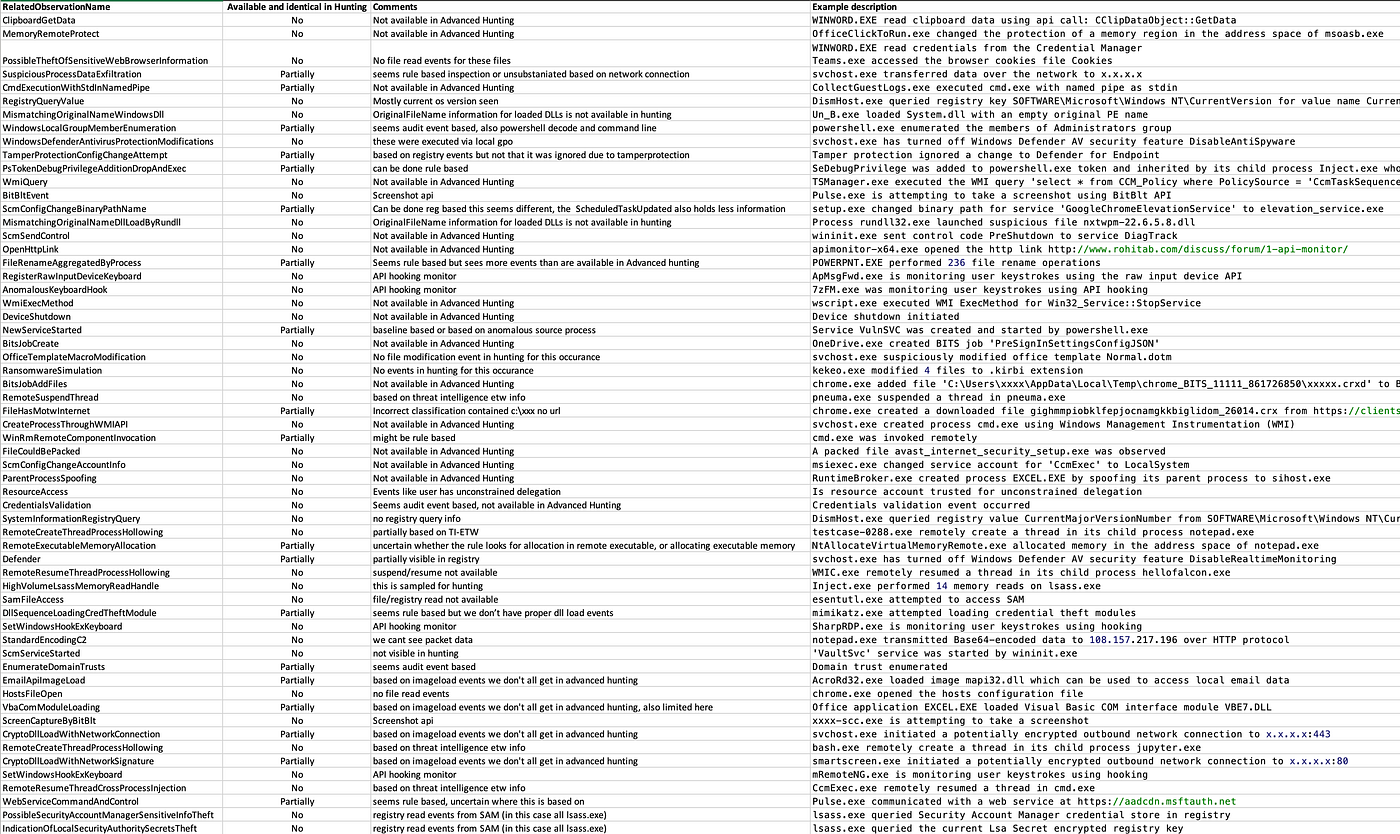
While not all of them are equally interesting, there are several very interesting events in there. Like most of the Threat Intelligence ETW events which contain all kinds of interesting API events for threat detection. Sadly, in its current state, this information is not usable for custom detections. Not until Microsoft will start to expose these observation events in the Timeline to the KQL interface, which I have good hope they will!
Conclusion
While I personally still don’t like the Timeline as an interface for conducting analysis on a machine, there is some value in doing so. At least until the information is also available in the Advanced Hunting tab. While Advanced Hunting obviously also is my personal preference, the Timeline is a great tool for a lot of people and it brings them a lot of value.
You are fine to use the Timeline as long as you are aware it contains an abstract of the available data.
Some other small lessons learnt for me:
- Exporting the Timeline is slooow, so you can’t do this concurrently at scale.
- Exporting the Timeline can be interesting for machines with an incident.
- The Timeline is a different sub-product, the data set is not fully available in Advanced Hunting.
- Searching the Timeline is very, very limited in the UI.
More
This article is part of a series, the other editions are listed below:
Appendix – CSV list of the event types
RelatedObservationName,Available and identical in Hunting
ClipboardGetData,No
MemoryRemoteProtect,No
PossibleTheftOfSensitiveWebBrowserInformation,No
SuspiciousProcessDataExfiltration,Partially
CmdExecutionWithStdInNamedPipe,Partially
RegistryQueryValue,No
MismatchingOriginalNameWindowsDll,No
WindowsLocalGroupMemberEnumeration,Partially
WindowsDefenderAntivirusProtectionModifications,No
TamperProtectionConfigChangeAttempt,Partially
PsTokenDebugPrivilegeAdditionDropAndExec,Partially
WmiQuery,No
BitBltEvent,No
ScmConfigChangeBinaryPathName,Partially
MismatchingOriginalNameDllLoadByRundll,No
ScmSendControl,No
OpenHttpLink,No
FileRenameAggregatedByProcess,Partially
RegisterRawInputDeviceKeyboard,No
AnomalousKeyboardHook,No
WmiExecMethod,No
DeviceShutdown,No
NewServiceStarted,Partially
BitsJobCreate,No
OfficeTemplateMacroModification,No
RansomwareSimulation,No
BitsJobAddFiles,No
RemoteSuspendThread,No
FileHasMotwInternet,Partially
CreateProcessThroughWMIAPI,No
WinRmRemoteComponentInvocation,Partially
FileCouldBePacked,No
ScmConfigChangeAccountInfo,No
ParentProcessSpoofing,No
ResourceAccess,No
CredentialsValidation,No
SystemInformationRegistryQuery,No
RemoteCreateThreadProcessHollowing,No
RemoteExecutableMemoryAllocation,Partially
Defender,Partially
RemoteResumeThreadProcessHollowing,No
HighVolumeLsassMemoryReadHandle,No
SamFileAccess,No
DllSequenceLoadingCredTheftModule,Partially
SetWindowsHookExKeyboard,No
StandardEncodingC2,No
ScmServiceStarted,No
EnumerateDomainTrusts,Partially
EmailApiImageLoad,Partially
HostsFileOpen,No
VbaComModuleLoading,Partially
ScreenCaptureByBitBlt,No
CryptoDllLoadWithNetworkConnection,Partially
RemoteCreateThreadProcessHollowing,No
CryptoDllLoadWithNetworkSignature,Partially
SetWindowsHookExKeyboard,No
RemoteResumeThreadCrossProcessInjection,No
WebServiceCommandAndControl,Partially
PossibleSecurityAccountManagerSensitiveInfoTheft,No
IndicationOfLocalSecurityAuthoritySecretsTheft,No
Knowledge center
Other articles
FalconFriday: Need for Speed: going underground with near-real-time (NRT) rules – 0xFF26
[dsm_breadcrumbs show_home_icon="off" separator_icon="K||divi||400" admin_label="Supreme Breadcrumbs" _builder_version="4.18.0" _module_preset="default" items_font="||||||||" items_text_color="rgba(255,255,255,0.6)" custom_css_main_element="color:...
How data science can boost your detection engineering maintenance and keep you from herding sheep
[dsm_breadcrumbs show_home_icon="off" separator_icon="K||divi||400" admin_label="Supreme Breadcrumbs" _builder_version="4.18.0" _module_preset="default" items_font="||||||||" items_text_color="rgba(255,255,255,0.6)" custom_css_main_element="color:...
Microsoft Defender for Endpoint Internal 0x06 – Custom Collection
[dsm_breadcrumbs show_home_icon="off" separator_icon="K||divi||400" admin_label="Supreme Breadcrumbs" _builder_version="4.18.0" _module_preset="default" items_font="||||||||" items_text_color="rgba(255,255,255,0.6)" custom_css_main_element="color:...

FalconForce realizes ambitions by working closely with its customers in a methodical manner, improving their security in the digital domain.
Energieweg 3
3542 DZ Utrecht
The Netherlands
FalconForce B.V.
[email protected]
(+31) 85 044 93 34
KVK 76682307
BTW NL860745314B01

