
Olaf Hartong
It is not a big secret that we at FalconForce work a lot with, and are big fans of, both Microsoft Defender for Endpoint (MDE) and Sysinternals Sysmon. I still use and maintain my Sysmon-modular configuration project quite frequently.
One of the questions we quite often get is whether one can replace the other, or whether implementing either of the products is enough. Honestly, like almost everything in in this industry, there is not a conclusive answer to this question.
Clearly both are products with different intentions. MDE is a commercial solution which has the ability to detect and act, besides generating telemetry. On top of that it also comes with an antivirus engine. Sysmon is available for free and purposely built for telemetry generation, detections and response actions need to be built by the operators.
This blog will primarily focus on the telemetry and detection engineering aspects of both tools.
Deciding what to use
When it comes to dealing with these two detection sources and choosing between them there are a couple of important things you’ll need to take into account.
Team maturity; First of all, the maturity of your team will drive this direction significantly. In order to have a deep understanding and ability to research most modern attacks, an inquisitive mindset as well as some higher grade of experience is mandatory. Doing an honest assessment of the current state and ambition of your team will support the decision making process on which of the two products to focus your efforts on.
Risk appetite; Next is the focus of the team, as well as the risk appetite of the organisation. If you are part of an already stretched team or you work for an organisation that has a high degree of risk acceptance it might not be a feasible to spend your time to duplicate efforts or a lot of time on research and development.
Budget; As with a lot of things in the world, money plays a big role here too. Working with either (or both) solutions comes at a price. MDE has a per machine/user license fee which includes storage and a mature team will also spend time on developing custom detections on top of the out of the box content. Sysmon is free to use, but requires maintenance of the configuration, shipping and storing the logs and all rules need to developed and maintained by your team.
Single solution
This is most likely a difficult call to make. Whichever of the two products you (or your management) decides to use, you’ll have to fully commit to its great and weak points; and use is to the best of your abilities. There might be all kinds of internal reasons for the decision, whether it’s budget, staffing availability, or risk appetite. In the end it will come down to knowing your tool intimately and building the best possible detection capability with it. Should you go for this path, you should full commit to utilizing the solution to the best of its capabilities before even considering an additional solution.
We regularly talk to people that want to add Sysmon alongside MDE for additional visibility on a very specific subject without, for instance, utilizing the custom detection capabilities of MDE. Often there is also an acceptable way of doing the same or something similar with what you have already in place.
Augmentation implementation
Due to the nature of both products, there is quite a bit of overlap in the telemetry generation capability. To save some time in developing duplicate detections on both sets of telemetry, it might be an idea to augment MDE with Sysmon telemetry on the points where it has limited or no capability (yet). Since you are ideally already evaluating your tools on a periodic basis, this direction allows you to cover the blind spots of the other one. Doing so should provide you with a higher detection rate.
Obviously, this entails some overhead since you’re working with two telemetry sets and will also have to ingest and store both of them, which evidently is more expensive. On top of that, the most important thing is to also utilize both products well; so building detections on both of these sources, or combine them into correlated events, to gain the best benefit. This also allows you to better monitor for tampering with each of the solutions.
Full capability / fallback implementation
From our experience, a lot of actors make an effort to disable AV or bypass EDRs, but Sysmon is often overlooked; which makes it a great addition to the defensive tool set. Therefore, if you have the time, capabilities and resources and the type of organisation where the risk acceptance is on the lower end of the spectrum, it might be a good idea to invest time into developing a configuration and detection repository that overlaps with the EDR and augments its blind spots at the same time. This way you have a fallback mechanism and a second pair of eyes concurrently. Should the attacker become aware of both solutions you’ll have at least some brief additional visibility into their attempts to circumvent or disable it.
In any case, going this route will imply quite some additional work. Not only does it require maintaining two tools, configurations and data streams; also the resulting alerts need to be tended to. There are a lot of possible ways to aggregate the duplicate solutions without adding an additional load to the analyst. The cool part about it is that having this duplicate stream is that also this can tell you something. For example, when there is only one solution firing where you know you have detections on both ends. This might be due to one of the tools failing or being tampered with, or that there is an attack variant that one of the solutions was incapable of spotting.
Knowing your tools, the strengths and weaknesses
At a first level glance it’s already clear that there is a big overlap between MDE and Sysmon, but both tools also have several unique abilities. One very clear distinction is the ability to load a custom configuration file to Sysmon.
MDE has a huge set of configuration options for telemetry generation, which is updated and downloaded from the cloud frequently and stored somewhere on the operating system. Sadly, at the time of writing, this is not something that is modifiable by customers.
Theoretical telemetry mapping
The easiest way to compare capabilities can be achieved in several ways through MITRE ATT&CK. One of them is to map the data sources mentioned in all technniques to the telemetry events a tool can produce. Keep in mind this is at best an indicative exercise since not everything can or will be logged.
What we’ve done for the screenshots below is plot the ATT&CK data sources per technique against the OSSEM Detection Model to show the number of data sources covered by our tool(s), in this case MDE and Sysmon. The darker the color, the more of the per technique mentioned data sources will be theoretically covered by telemetry.
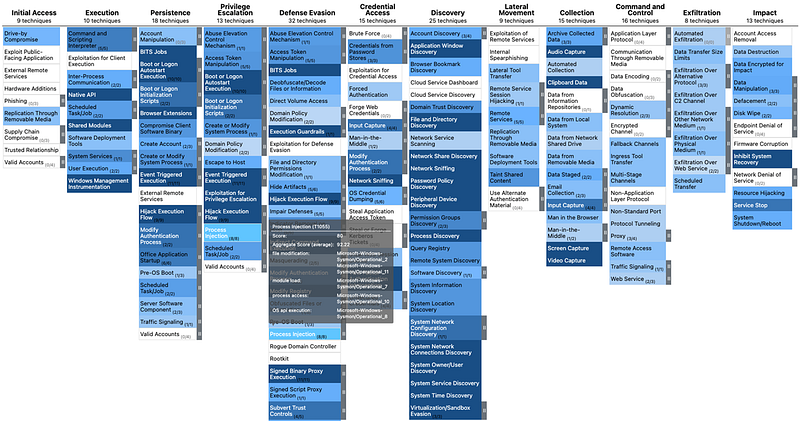
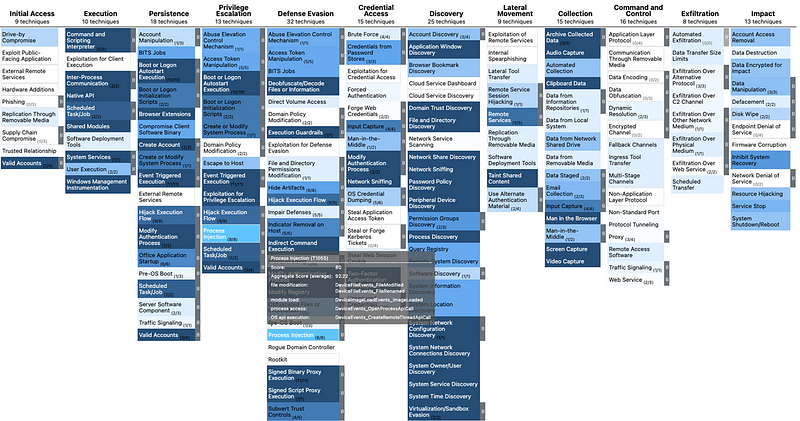
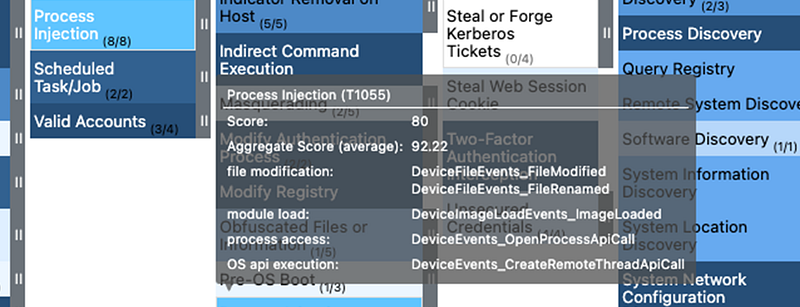
Close up you can see the mappings in more detail. All ATT&CK data sources are mapped to the proper MDE table and to add detail also the proper ActionType. The score is based on the percentage of data sources having a mapping to a telemetry source.
As you can see, and might have expected, there is quite some overlap in the potential telemetry available so it might make sense to dig a little bit deeper.
Telemetry head to head
To be able to properly compare the quality and verbosity of the telemetry of both products, we’ll need to look at the data actually generated. This can, for instance, be achieved by utilizing a set of attack simulation scripts, like the Atomic Red Team project. Ideally, you’ll do a lot more custom research, but for this exercise in telemetry comparison Atomic Red Team is already quite adequate.
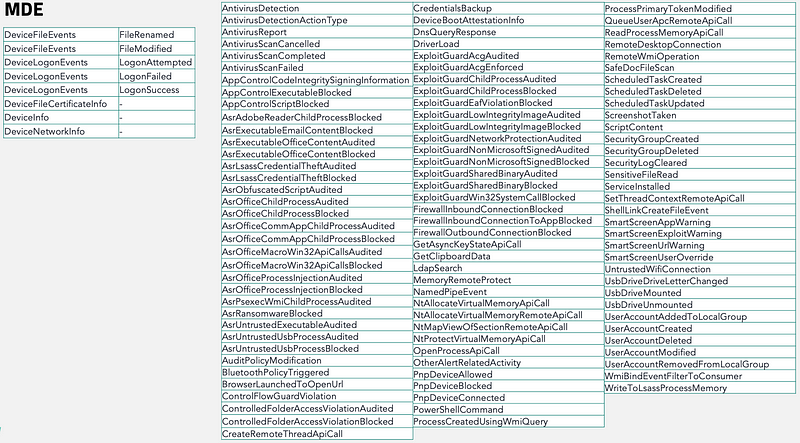
Digging through the generated data in both MDE and Sysmon, and augmented with my experience from a lot of time spent engineering detections on both telemetry sources, we end up with the following comparison overview. This overview is based on what Sysmon has and what MDE offers in comparison.
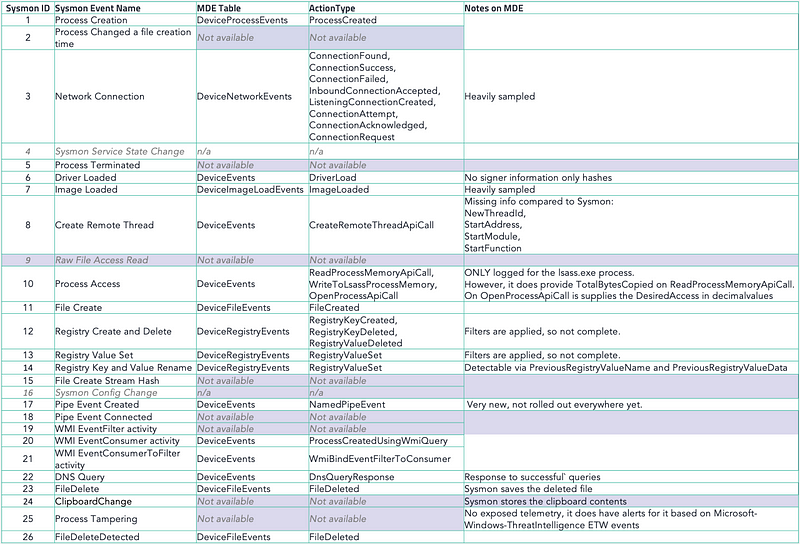
Please note that besides the events generated by MDE above there is a wealth of (frequently updated) events it provides telemetry for. An overview of the events available at the time of writing this blog is visible in the screenshot below.
Telemetry configuration
To be able to rely on a tool, I always want to know 1) how it gathers its telemetry, and 2) what filters are applied before it ends up in my data analytics platform.
As mentioned before, Sysmon requires you to provide it with a configuration that allows you full control to tell it what to write to the EventLog and what not to log. Sysmon-modular was built exactly for this and makes it easy to maintain it also for different environments.
The same is true up to a certain degree for MDE, the big distinction is that Microsoft 100% determines and maintains this configuration without easy access for the user. This is not a huge problem for most people, but if you want to know what its blind spots are and how it filters or samples this is a different story. As you might expect with a configuration for a complex product as an EDR, there are all kinds of filters applied to keep it performing well and also to keep the data volume sent to the cloud manageable for the vendor. Besides per-event filters MDE has a set of global limits.
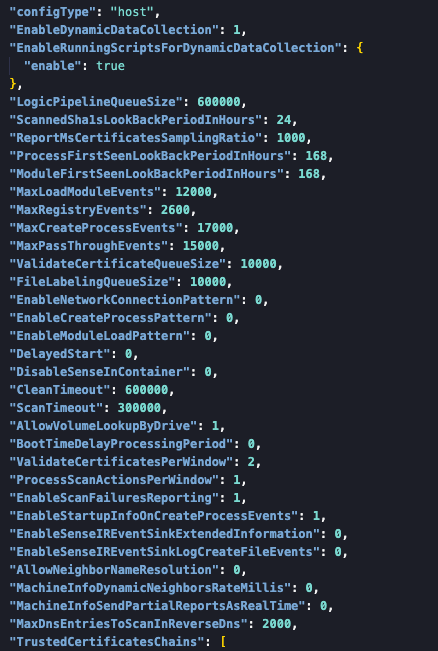
In most cases all these limits should not be the cause of blind spots, but on some systems this might cause you to miss certain events.
Telemetry acquisition
In different capacities Sysmon and MDE rely on several Event Tracing for Windows (ETW) providers. In short, ETW is a kernel-level tracing facility embedded in Windows that lets you log kernel or application-defined events. ETW is at the core of all Event Logs and a lot more monitoring implementations.
Sysmon only gathers DNS data from ETW and writes to its own ETW provider in order to get all data into the EventLog. Moreover, Sysmon collects all of its other information through kernel callbacks via its own kernel driver.
MDE consists of many building blocks and as one of the sources for its telemetry it uses a large set of (sometimes protected) ETW providers.
ETW is an extremely rich data source that also contains a lot of information that is not required for security purposes. There is a set of filters applied per provider in MDE to not get a firehose of data that will not be utilized.
These filters consist of the Event IDs per provider MDE is interested in, but they also contain some metadata. And more importantly: caps to limit the amount of generated and therefore ingested telemetry.
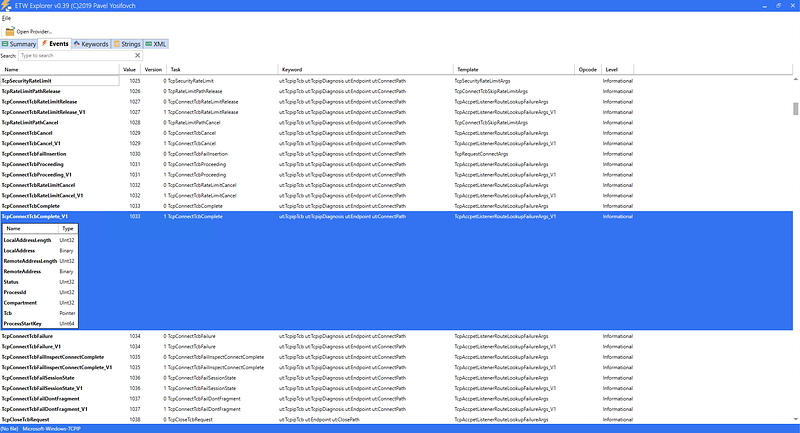
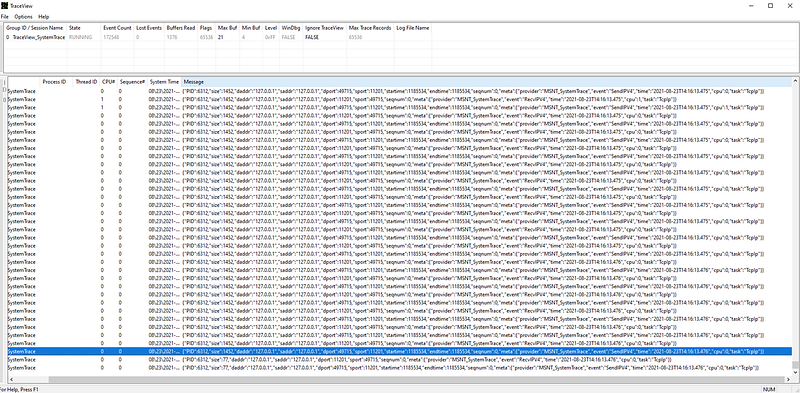
As an example, the screenshot below shows a part the Microsoft-Windows-TCPIP ETW provider manifest, which can be easily visualized with ETW Explorer by Pavel Yosifovch. As you can deduce from the very long scrollbar, there are several hundreds of events to subscribe to.
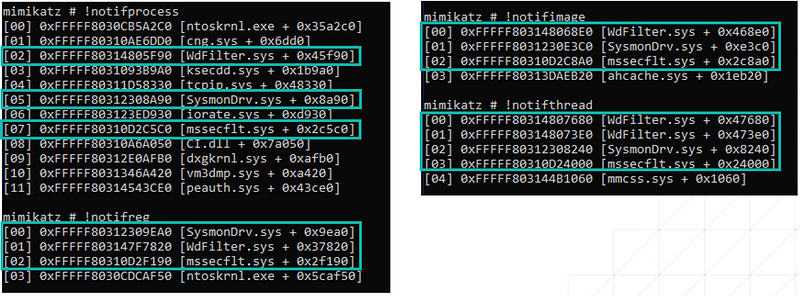
Kernel Callbacks
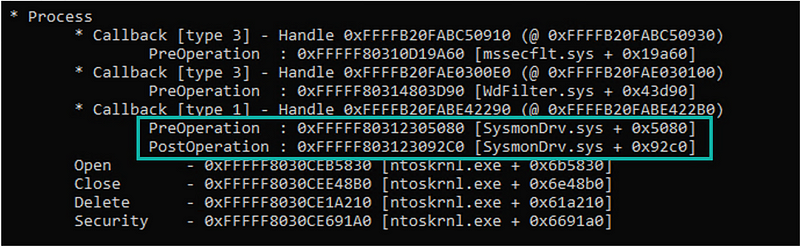
Sysmon relies almost completely on kernel callbacks to get all the information it is able to log. MDE also makes quite some use of this besides the ETW subscriptions. Windows Defender, part of MDE, even has its own callbacks and can work independently from the EDR component.
This is also where we are able to see why Sysmon has process termination logging and MDE does not, simply because they don’t have that callback set for the PostOperation of a process, only the PreOperation.
Both engines also do some additional magic on the background to enrich these events. For instance, network callback events do not have the same rich information that gets logged by both engines; this is enriched by caching the process information and adding that to the trace information.
Sysmon telemetry considerations
As mentioned earlier in this post, the quality of your Sysmon datastream heavily relies on your configuration. Maintaining this configuration requires a certain degree of research and frequent updates to not have blind spots in your telemetry. This argument is obviously equally valid for the detection aspect, where MDE might have an out of the box detection already implemented. With Sysmon there is no option to sample your telemetry, once you configure something to be logged you can expect it to store all of the occurrences.
The upside of this obviously is that you know what you should see and what you have filtered from being logged.
MDE telemetry considerations
As we have seen earlier in this blog post, MDE has a wealth of additional information over Sysmon. Not all of the overlapping events are equally matched in verbosity. Keep in mind that Microsoft is running a balancing act between cost, maintainability and performance on the endpoint and bandwidth. They do their best to provide most customers with a good solution, which might be too much for some and falling a bit short in some areas for some others.This is not a criticism, it’s a totally fair business case. Knowing about this is where you can decide what to do about this.
A snippet of the MDE configuration below where it specifies one of the events from the Microsoft-Windows-TCPIP provider us quite a couple of things for this single event.
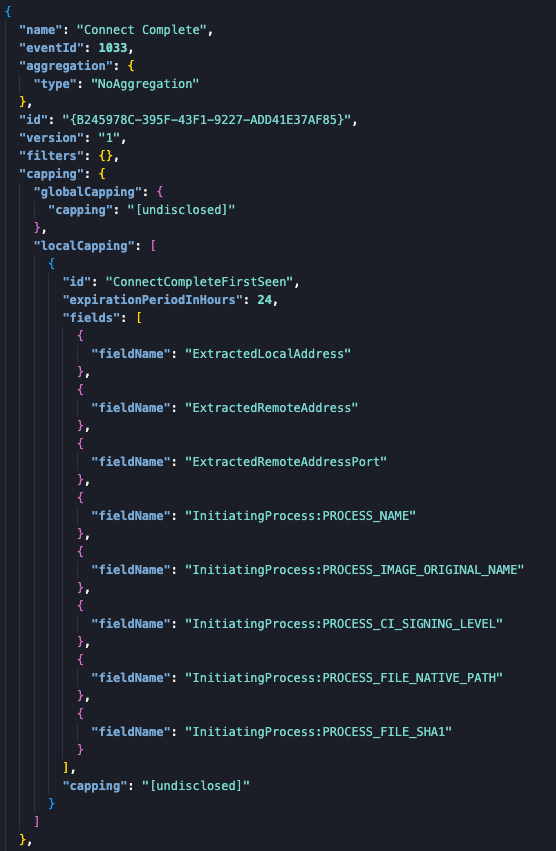
Obviously it involves a completed TCP/IP connection event. Some of the fields from the provider are extracted and enriched with the InitiatingProcess information that is derived from the information tied to the ProcessStartKey field. ProcessStartKeys were introduced in Windows 10 build 1507 and are intended to serve as a locally unique identifier for a process.
But this is not all, there are two caps visible there, the ‘globalcap’ of [undisclosed] which limits the total number of this event per 24 hours for this machine to that number of events in total. Next, there is also a ‘localcap’, which in this example is named ConnectCompleteFirstSeen. This event also has its own expiration, which in this example is also 24 hours and a localcap for this event specifically. This means that for every event that has the fields names in the fields array only x event(s) per day will be logged.
A simple example will make it more clear to understand the impact of the above configuration to the telemetry and custom detection implications. Let’s say we’re looking at a piece of malware that is executed on a machine and sets up a command and control channel to a server on the internet and keeps checking in approximately every 10 minutes for instructions. With the configuration above, the number of log events of this network activity will be just a limited number of connections to the command and control server; the rest of the beaconing behavior is not stored, since the process and network information is not changing. Keep this in mind when you’re writing detections or when you are investigating an incident.
All ETW-based event types have a configuration like this. Obviously, the parameters and caps differ per event. Make sure to investigate the events important to you.
However, there is a big caveat here. This is the default behavior of the telemetry engine. As mentioned before, MDE consists of many components locally installed on the endpoint as well as in the cloud. One of its components is the NetworkProtection module which logs all network traffic to its own ETW provider. Should one of the MDE engines classify the binary or the traffic as suspicious, it can decide to send more telemetry to the cloud. In most of our test cases this still does not store all events, but will provide more information to investigate. So far, we have not been able to determine how and when it decides to change the default behavior, nor can we fully reproduce this behavior. These telemetry sources, when important to you in your detection requirements, would be a great example for the augmentation implementation of Sysmon to make sure the traffic patterns you are interested in are always logged.
Conclusion
Both tools have their strong and potential weaker points. Depending on the maturity of your team, its budget and the risk appetite of the organization there are no bad choices when either is, or both are, applied thoroughly. To an extend it comes down to flexibility, easy of use, maintenance comfort, etc. which might also help sell either one internally.
Regardless, both are great to work with and provide a wealth of detection opportunities. Even some of the less ideal parts of each product can be acceptable for your use, so it doesn’t have to be a problem directly. Knowing what it can and cannot do is key though…
Regardless of what tool you decide to use, if you rely on any tool for your detection capability, make an effort to understand how it works. Get a deeper understanding of its inner workings, its configuration and limitations. Don’t rely on the marketing promises and fancy dashboards. This allows you to make decisions on how to deal with them, augment them or accept a blind spot when you have a good reason to do so.
Ultimately it is a time and effort (cost) versus risk acceptance discussion. Applying one solution really well still has preference over implementing both in a mediocre way.
Knowledge center
Other articles

FalconFriday: Need for Speed: going underground with near-real-time (NRT) rules – 0xFF26
[dsm_breadcrumbs show_home_icon="off" separator_icon="K||divi||400" admin_label="Supreme Breadcrumbs" _builder_version="4.18.0" _module_preset="default" items_font="||||||||" items_text_color="rgba(255,255,255,0.6)" custom_css_main_element="color:...

How data science can boost your detection engineering maintenance and keep you from herding sheep
[dsm_breadcrumbs show_home_icon="off" separator_icon="K||divi||400" admin_label="Supreme Breadcrumbs" _builder_version="4.18.0" _module_preset="default" items_font="||||||||" items_text_color="rgba(255,255,255,0.6)" custom_css_main_element="color:...

Microsoft Defender for Endpoint Internal 0x06 – Custom Collection
[dsm_breadcrumbs show_home_icon="off" separator_icon="K||divi||400" admin_label="Supreme Breadcrumbs" _builder_version="4.18.0" _module_preset="default" items_font="||||||||" items_text_color="rgba(255,255,255,0.6)" custom_css_main_element="color:...

FalconForce realizes ambitions by working closely with its customers in a methodical manner, improving their security in the digital domain.
Energieweg 3
3542 DZ Utrecht
The Netherlands
FalconForce B.V.
[email protected]
(+31) 85 044 93 34
KVK 76682307
BTW NL860745314B01