Olaf Hartong
Recently at Wild West Hackin Fest, I spoke about a powerful new tool we’ve been working hard on and now is available to the public: FalconHound.
Ever since it was released in 2016, BloodHound has been the go-to tool for security practitioners to uncover misconfigurations in Active Directory and Azure. What I see at a lot of our clients and hear a lot in the community is that blue teams struggle to adopt BloodHound into their workflow. Also, running regular scans and analyses seems (in most cases) to be restricted to once every 6 months to a year. Lastly, we don’t see many detection teams leverage BloodHound for mitigations and detections, let alone for enrichment or alert investigations.
While there is truth to it, this quote by John Lambert has always bugged me a bit:

We wanted to bridge that gap and enable more defenders to have solid access to graphs too. Some of the common challenges we hear about collecting SharpHound and AzureHound data is primarily regarding the session collection. First and foremost, this is always a moment in time snapshot. To get some form of a representative state requires collection during work hours, in the part of the company where you are collecting. For companies that have offices around the world this requires some more scheduling or planning.
Another common issue is that, due to network segmentation, local firewalling and host isolation, not all machines are reachable. In principle, this is a great thing, except we also will not get session data for machines placed in these segments. Due to these limitations you’ll never have a good grasp of all potential attack paths in your environment.
Fortunately, blue teams have the most valuable asset available to address this information gap, and open up way more possibilities at the same time. We have all these logs available which we can put to great use here. For example we have data on:
- User logons / logoffs and unlocks
- User / group / object modifications
- Role assignments
- Computer account creations and much, much more
Best of all, since in most organizations all these events are collected in a SIEM or log aggregation platform we can use this to get that comprehensive overview, in near-realtime!
This is exactly why we’ve created FalconHound. The primary goal of the tool is to enable the utilization of all these different events and update the BloodHound database.
FalconHound
FalconHound is a utility written in Golang. This allows us to compile for all major operating systems and architectures. It also results in a single binary that will run without any requirements to be installed, which makes implementation simple and quick.
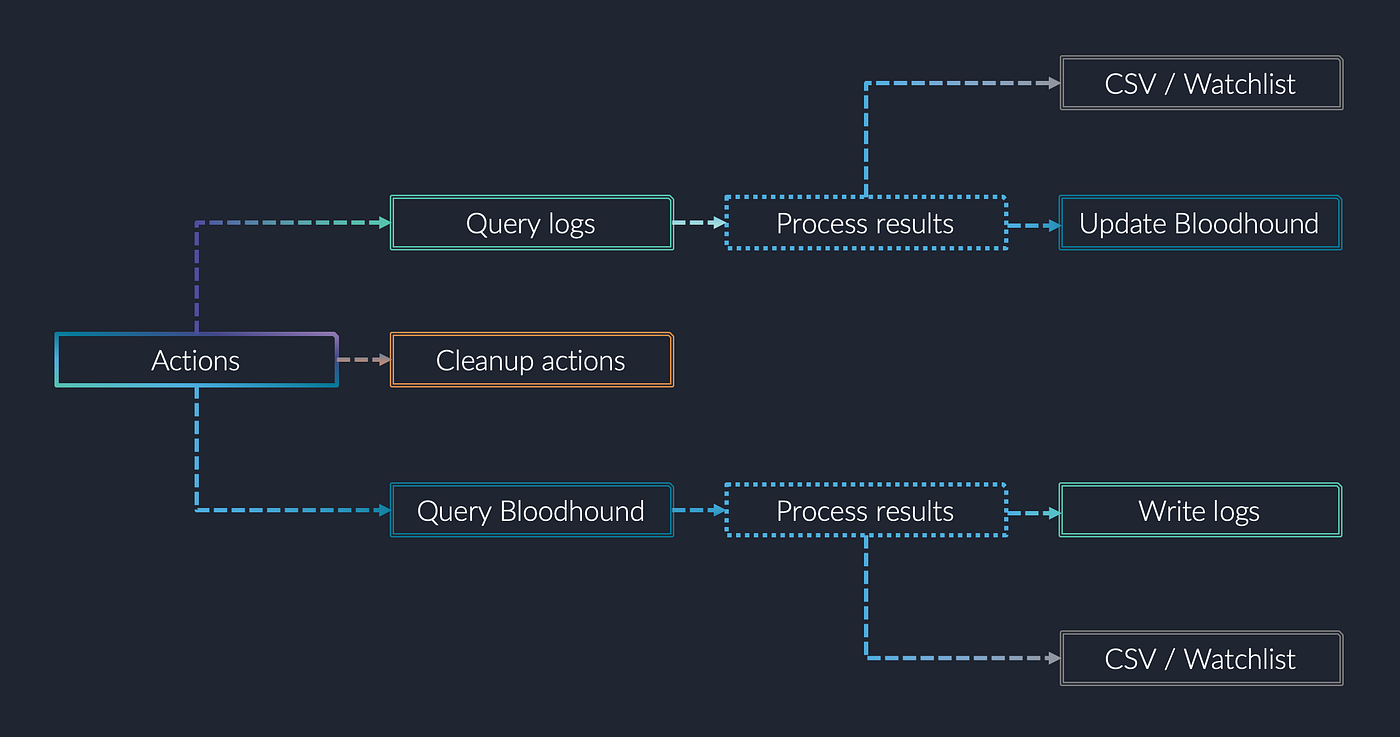
FalconHound will connect to many APIs to gather information defined in action configuration files and stores the results to the one or many destinations of your choice.
At the time of writing, FalconHound supports Microsoft Sentinel, Microsoft Defender for Endpoint, Splunk, Microsoft Graph API and Neo4j. Support for BloodHound Community Edition and Enterprise is under active development.

For example, we can query the Security events in Sentinel for new logon events in the past period and create a new session for each of the results from this query and write this to the BloodHound Neo4j database. Consecutively, we can query the Neo4j database for paths from users that have a session to a computer that have a path to high-value targets. Should that query yield any results, we can write these to a predefined Sentinel table and use this for alerting or prioritization.

Actions
Each task or action executed by FalconHound requires its own configuration file. A template for these actions is available within the project repository. These actions allow native queries for the Source and Target to make adoption as accessible as possible. Also, multiple targets are allowed.

As long as they are marked as ‘active’, actions will be executed. Also, there is a debug mode that can be enabled per action. This will output all results for both the source and target query to the stdout, allowing you to troubleshoot a log query or Neo4j update query. For example, several items in the BloodHound dataset are upper-case, and in logs often not. This will result in the item not to be found if you forget to convert them to uppercase. This example is totally random and definitely has not costed me a lot of time, several times, to troubleshoot ;).
Note that all actions are processed in alphabetic order. This is, for example, why the Neo4j-based actions are placed in the 10-Neo4j folder. Since we require the logs to update the database first, it stands to reason that the queries to the graph database need to be executed last.
Within the Neo4j folder there are also several cleanup actions. These actions take care of, for example, the timing out of sessions, the removal of the owned object when there are no more alerts on systems, and so on. Again, these have a 0 prefix to assure the following queries are working with the data in de desired state.
By default, all active actions will be executed. However, should you want to run only one or a few of the actions, you can specify the actions by ID you want to run after the -ids parameter.
Keep in mind that some queries can generate a lot of results in large environments. For example, in the screenshot below there are 5361 sessions to be updated. Most people will be running on the community edition of Neo4j, which is restricted to single-threaded operations. This can cause these updates to take a while.

Action examples
Besides querying the logs for new logons that will result in new HasSession edges between users and computers, we can do way more. Equally interesting is the creation of new accounts, adding them to groups or assigning them roles and so on. Most of these actions have already been created, but feel free to contribute more to our repository. We are also collecting other special events and below are some examples.
Owned resources
One of the other things we can do — which I think is really cool — is we can sync alerts from your security products that are connected to a user or computer and mark them as owned in the database. For each new alert the owned property is set on the node and the alertid is added to the alerts property on that node. Once the alert is resolved or closed the alertid will be removed from the alerts property. Additionally, there is a cleanup action that will remove the owned property from the node once the alerts property is empty.
Exploitable resources
Microsoft Defender for Endpoint has the capability to scan for vulnerabilities on onboarded devices. In addition, Microsoft maintains a database with CVEs and whether there is a publicly-known exploit for it available, which makes it more likely that that host can be exploited. There is an MDE-based action in FalconHound that will query for newly discovered CVEs on machines that have a public exploit available. These machines will be tagged as exploitable and will have an exploits property that contains the CVE(s).
Exposed resources
Microsoft Defender for Endpoint has a log source that can show whether a machine has ports available to the public on the internet. The way this works is that Microsoft has several machines running a port scan over the internet. They use machines at different cloud providers for this, to make sure not only Microsoft IP blocks are allowed access. This scan data is correlated on the backend with the successful inbound connection information from the host, which indicates the machine is actually successfully accessible from the internet. We can query this data with an MDE action and for the resulting machines we can tag these as exposed and add the ports property and populate this with the accessible ports.
The action in the repository only looks for the more dangerous ports in terms of remote connectivity (3389, 445, 389, 636, 135, 139, 161, 53, 21, 22, 23, 1433), but this is adjustable in the action.
There is a lot more interesting information being collected; feel free to have a look in the actions folder.
Session tracking
Since we are synchronizing new sessions to our BloodHound database, it also makes sense to remove these sessions once they are no longer active. However, this also can cause potential blind spots in path calculations while doing follow-up investigations on alerts or other raised triggers.
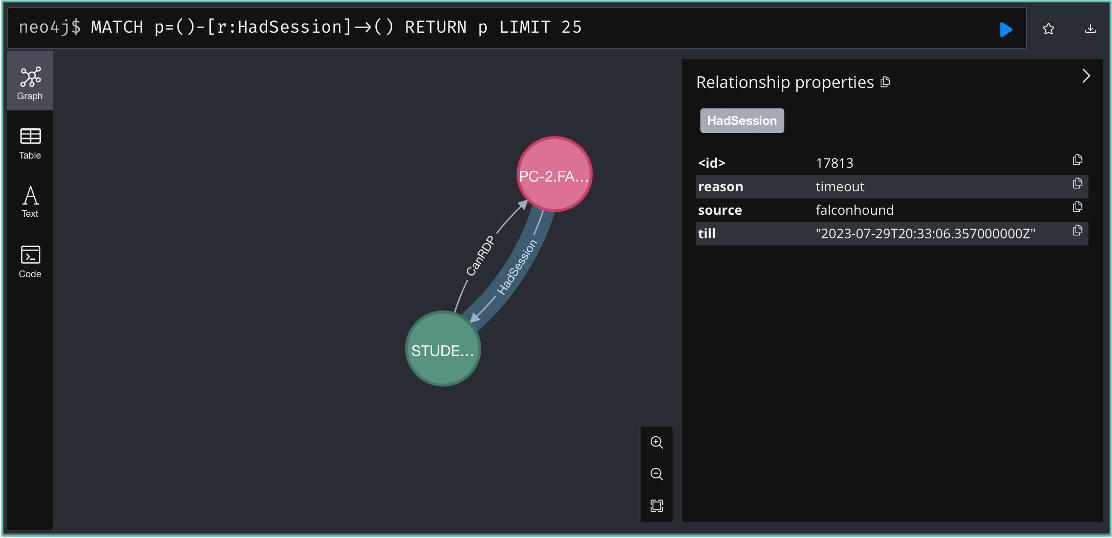
This is why I introduced another edge, the HadSession. This allows us to remove an active session (HasSession) on a machine for a user and register it as a former session on that machine.

This opens up a lot of opportunities for new path discovery as well. While a user does not have a current session, often they are likely to return to that machine and log on again, re-establishing an active session. If this is the case for multiple machines in a path, hypothetically that path exists. However, in the traditional way of collecting this would be very unlikely to show up.
While there is no current support by BloodHound for this edge, it will show up fine and should be incorporated in all path-based calculations, unless edges are specified in your query of course.
Implementation
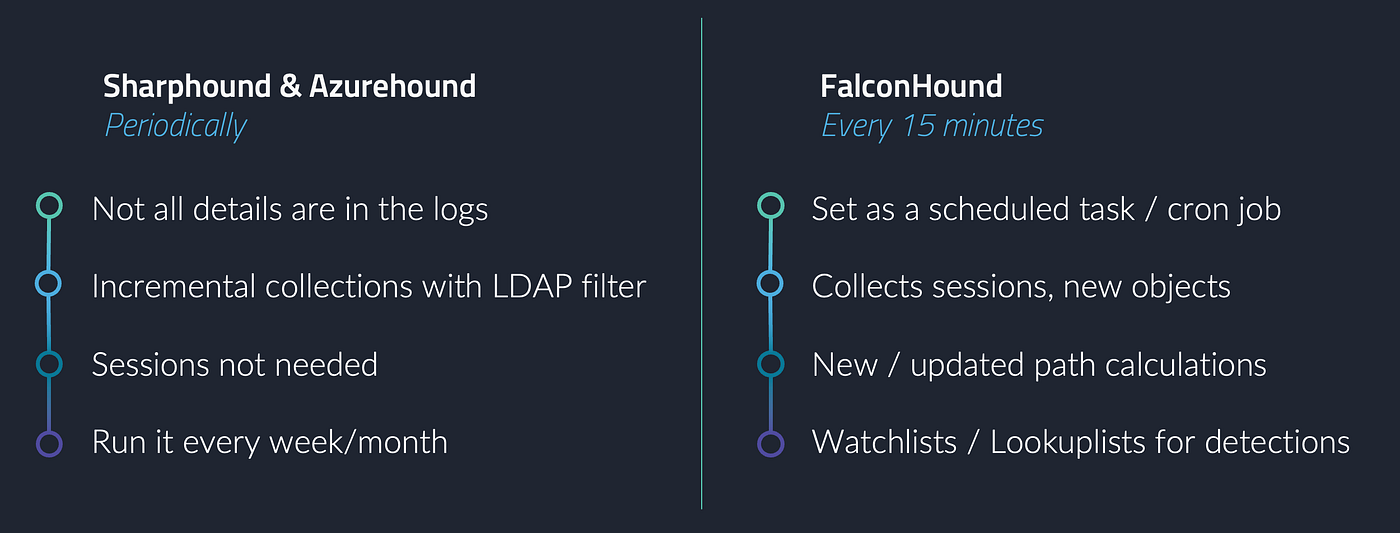
While FalconHound brings great features for staying up to date with all changes to your environment, there still is a benefit to running the collection agents supplied with BloodHound. The primary reason for this is that not all details on an entity in Active Directory, EntraId and Azure are available in the logging. So, when implementing, ideally you create a scheduled task or cronjob for FalconHound to run every 15mins and run both Sharphound and Azurehound every week/month — depending on what is manageable to you. These processes can also be automated. For example, my colleague
created a Docker container to run AzureHound with a managed identity and blogged about it.

To make collection faster and more efficient, Sharphound allows you to use LDAP search filters. This way, you can only retrieve the newly updated information since the last time you ran the collection, making it much faster to collect and import. An example command is:
sharphound -c DCOnly -f '(&(objectClass=* (modifyTimestamp>=20231001000000Z))' -Domain x.yz etc
What can we do with this new data?
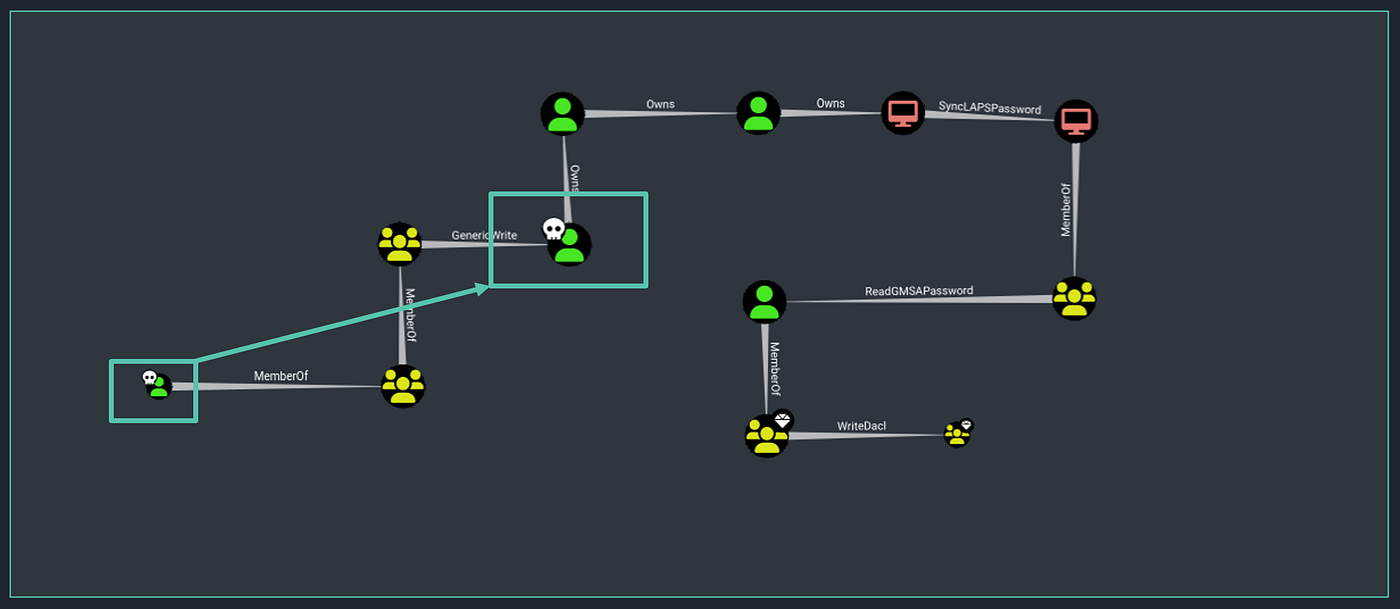
Now we have the results of these actions flowing into Sentinel (or Splunk) we can use this to start creating detections. For example, the query below looks at paths from owned users to high-value assets. The detection is built to alert once there is a difference between the result from the previous run and the current run and show the difference, in this case new paths.

The same can, for instance, be done for owned entities or exploitable or exposed computers to a high-value resource. You can generate a new alert or re-prioritize the related alert to a higher level when there is a path.

Watchlists
Some of the data queried can make more sense as a watchlist, where it can be incorporated into multiple detections to provide context, prioritization or an up-to-date source of, for instance, domain controllers.

Enrichment
One of the other interesting and very useful enrichments that can be done with this data, is do some basic Cypher searches based on any user/computer/app registration etc. in an alert and collect information that can give an indication of the impact of a compromise of that resource. For example, ownership permissions on x assets, control over y objects, also has an admin account, and much, much more.
Analyst support
One of the additional features built into the YAML schema is the ability to provide a Cypher query that will be added to the log entries upon results.
This allows you to add a Cypher query for analysts to run in BloodHound to investigate the path you were alerting on graphically.

Lateral movement / path traversal
Since FalconHound is capable of syncing sessions and alerts we now also can uncover lateral movement across paths. When a path starts showing multiple alerts, it is also possible to predict where an attacker might move next and allow the defensive team to focus on investigating the next hop; and potentially cut off that path. It is quite likely the attacker sees the same path information, but is not aware the defenders are using it too.

Obviously, there are way more possibilities for enrichment and path discovery; this is only the beginning. We at FalconForce believe in the value of this additional platform to strengthen detection and response capabilities. We will continue to develop and improve the tool and actions library, but also want to invite you to support the project with contributions.
With that, I hope we can bend John Lamberts quote at the beginning of the blog to our advantage.

Feel free to reach out with ideas, comments and feedback!
We’d love to hear your stories. You can find us on GitHub, Discord, LinkedIn and Twitter (X).
Knowledge center
Other articles
FalconFriday: Need for Speed: going underground with near-real-time (NRT) rules – 0xFF26
[dsm_breadcrumbs show_home_icon="off" separator_icon="K||divi||400" admin_label="Supreme Breadcrumbs" _builder_version="4.18.0" _module_preset="default" items_font="||||||||" items_text_color="rgba(255,255,255,0.6)" custom_css_main_element="color:...
How data science can boost your detection engineering maintenance and keep you from herding sheep
[dsm_breadcrumbs show_home_icon="off" separator_icon="K||divi||400" admin_label="Supreme Breadcrumbs" _builder_version="4.18.0" _module_preset="default" items_font="||||||||" items_text_color="rgba(255,255,255,0.6)" custom_css_main_element="color:...
Microsoft Defender for Endpoint Internal 0x06 – Custom Collection
[dsm_breadcrumbs show_home_icon="off" separator_icon="K||divi||400" admin_label="Supreme Breadcrumbs" _builder_version="4.18.0" _module_preset="default" items_font="||||||||" items_text_color="rgba(255,255,255,0.6)" custom_css_main_element="color:...

FalconForce realizes ambitions by working closely with its customers in a methodical manner, improving their security in the digital domain.
Energieweg 3
3542 DZ Utrecht
The Netherlands
FalconForce B.V.
[email protected]
(+31) 85 044 93 34
KVK 76682307
BTW NL860745314B01


