Olaf Hartong
In the previous edition of this series I discussed the Timeline telemetry. Since that blog the number of action types in the Timeline telemetry has certainly grown. If you’re interested to work with this data, I’ve added exporting this data as a feature to the tool released below.
This edition will zoom in on several capabilities of the M365D platform that are interesting to monitor for abuse, primarily Live Response.
Sadly, most of this activity telemetry is not readily available for querying programmatically and not officially supported my Microsoft. Hopefully, this will change in the near future.
Live Response, the perfect C2
I’ve been meaning to build detections for the (ab)use) of the Live Response feature for quite a long time. When our red team actively used it in some operations recently at our clients, I was committed to help our clients in detecting this behavior.
Live Response is a great and powerful, but also a potentially hazardous, capability. Fortunately, there are additional permissions required to be able to use it, so abuse will require some effort. First of all, Live Response needs to be enabled; this requires admin privileges or the “Manage Portal Settings” permissions. Additionally, there are ways to restrict access to certain device groups in Live Response. Definitely do this for your Tier-0 assets, for instance. You don’t want everyone with Live Response privileges to be able to run commands on these assets.
Should an attacker manage to compromise the session or credentials of a privileged user, they may abuse the Live Response capability for their own gain. The same is of course true for any authorized user with malicious intent that has access to this capability.
Besides compromising credentials, an attacker might find an attack path through compromising a Service Principal and granting it additional permissions if it has that capability. Or just stumbling on the credentials for an app registration which has the proper permissions already.
Clearly, there can be several paths that lead to access to the Live Response capability. This blog will not focus too much on the road to the capability. Instead, this blog will dig into monitoring the use of the Live Response capability, which you’ll learn is challenging enough already :\
Live Response capabilities
Within the M365D portal operators can use a set of actions to analyze a device, interact with it and even take some blocking actions.
These actions include traversing the filesystem, getting files and dumping memory from the machine, getting some basic overviews, running commands and isolating the machine.
Live Response commands are a bit limited by design. You can’t run just any command directly on a machine. However, you can run scripts from the Live Response library. You can also upload your own scripts to this library, allowing you to run whatever you prefer. This obviously is also very appealing to an attacker.
Monitoring Live Response activity
To my knowledge, there is not much documented on the record-keeping of all these actions in the official Microsoft documentation. There is some basic information on the topic, but nothing on how it has been architected and how to analyze it. At least, I was not able to find it.
From what I’ve managed to uncover, there can be a record of activities in three different places:
1. The Action Center History.
2. The Machine Actions record, queryable (only) via the API.
3. The Unified Auditlog.
TL;DR;
None of records mentioned above contain all information. In fact, there does not seem to be a full logic behind the stored data, since what is stored where is inconsistent and some of it is broken entirely. The lack of clarity may likely lead to improper assessments and therefore false conclusions, causing a potential attack or abuse-case to remain unnoticed. Additionally, I don’t understand why there isn’t a more accessible way to access this data programmatically. These are logs of most sensitive and impactful actions. During a breach or investigation you’d want to have proper access to these logs and not having to jump through all kinds of hoops to get it, and wonder if it’s still there.
PS: if you’re reading this while investigating an attack, I feel you. Hope you’ll find what you’re looking for 😉
The Action Center History
The Action Center is part of the M365 Defender portal. Here, with the proper permissions, you can view actions taken on your assets on the history tab.

As you can see in the screenshot above there is an overview of all kinds of activities, also ones that are automatically taken. This blog will focus primarily on the Live Response actions. There are more events in this overview that are executed by the several protection engines. For instance, quarantine file, stop processes, automatic user disablement, etc. You also want to be aware of some of these, so ingesting them makes a lot of sense.
Overall, I’ve seen the following Live Response-related actions being recorded:

Note: I deliberately state each source as a portal action, since actions taken over the API do not seem to be listed here.
Getting the data from the Action Center History is not ideal. There is no official API and the only option provided to us is the Export button, which generates a CSV file of the same overview. Obviously, this is severely limiting our automatic detection options if we want to monitor for abuse.
However, everything about this portal consists of service APIs, so we can still get it, albeit way less ideal. Since the Action Center History is part of the website, and not the public API, there isn’t a supported way of assigning a service principal to access this part. Sadly, we’ll be required to use a user account for this…. More on this further down.
The Machine Actions API
M365D has a pretty comprehensive API which you can use for all kinds of automatic integrations and analysis capabilities. One of which is the Live Response component.

With the right credentials you can access the /api/machineactions endpoint with a GET request. This will list the events of the past 6 months or a maximum of 10.000 events. The data is returned in JSON. Additionally, the API has a rate limit of 100 calls per minute and 1500 per hour. For only getting the logs this is fine of course. But at some point this limit might become tight with many automations in place.
Now this is where it becomes a bit confusing. The information available via the Machine Actions API is mostly regarding API activities for the Live Response actions. However, there are also some portal events available, but not all and the ones that are there are not all consistently logged.
With a small logic app these events can be easily gathered from the API and ingested into a platform like Log Analytics or Azure Data Explorer. From here, the events can be easily analyzed and you can even build detection content upon them.

A sample Logic App can look like the one in the screenshot above. This example Logic App talks to the MDE API every 10 minutes and gets the Machine Actions, filtering on the timestamp of the last 10 minutes. Next, it checks whether the event has more than 0 actions in it and then forwards it to Log Analytics.
Happy to see the ease of onboarding this data, I was eager to start building detections for abuse of the Live Response capability. Sadly, when looking into the actions I took via the API and portal I was immediately disappointed to see only the API activities there, and — for some reason — the isolation actions I took via the portal. All other activities taken via the portal, like running scripts, getting files and so on, were missing here.
Unified Auditlogs
As part of an earlier effort to get value from the Unified Auditlogs, I spent quite some time to get these audit events onboarded. According to the documentation, M365D events should be included. So, I had high hopes on finally getting all my desired events. I don’t believe I’m understating that getting these logs is the most user-unfriendly way of getting logs out of any of the Microsoft solutions.
To get this to work you need to;
1. Turn Office 365 audit log search on or off
2. Create subscriptions to the audit logs you want
3. Connect these subscriptions to a webhook
With the hardest part done, we can now get that webhook active and start processing events. There are all kinds of ways to do this. I chose to use another Logic App.
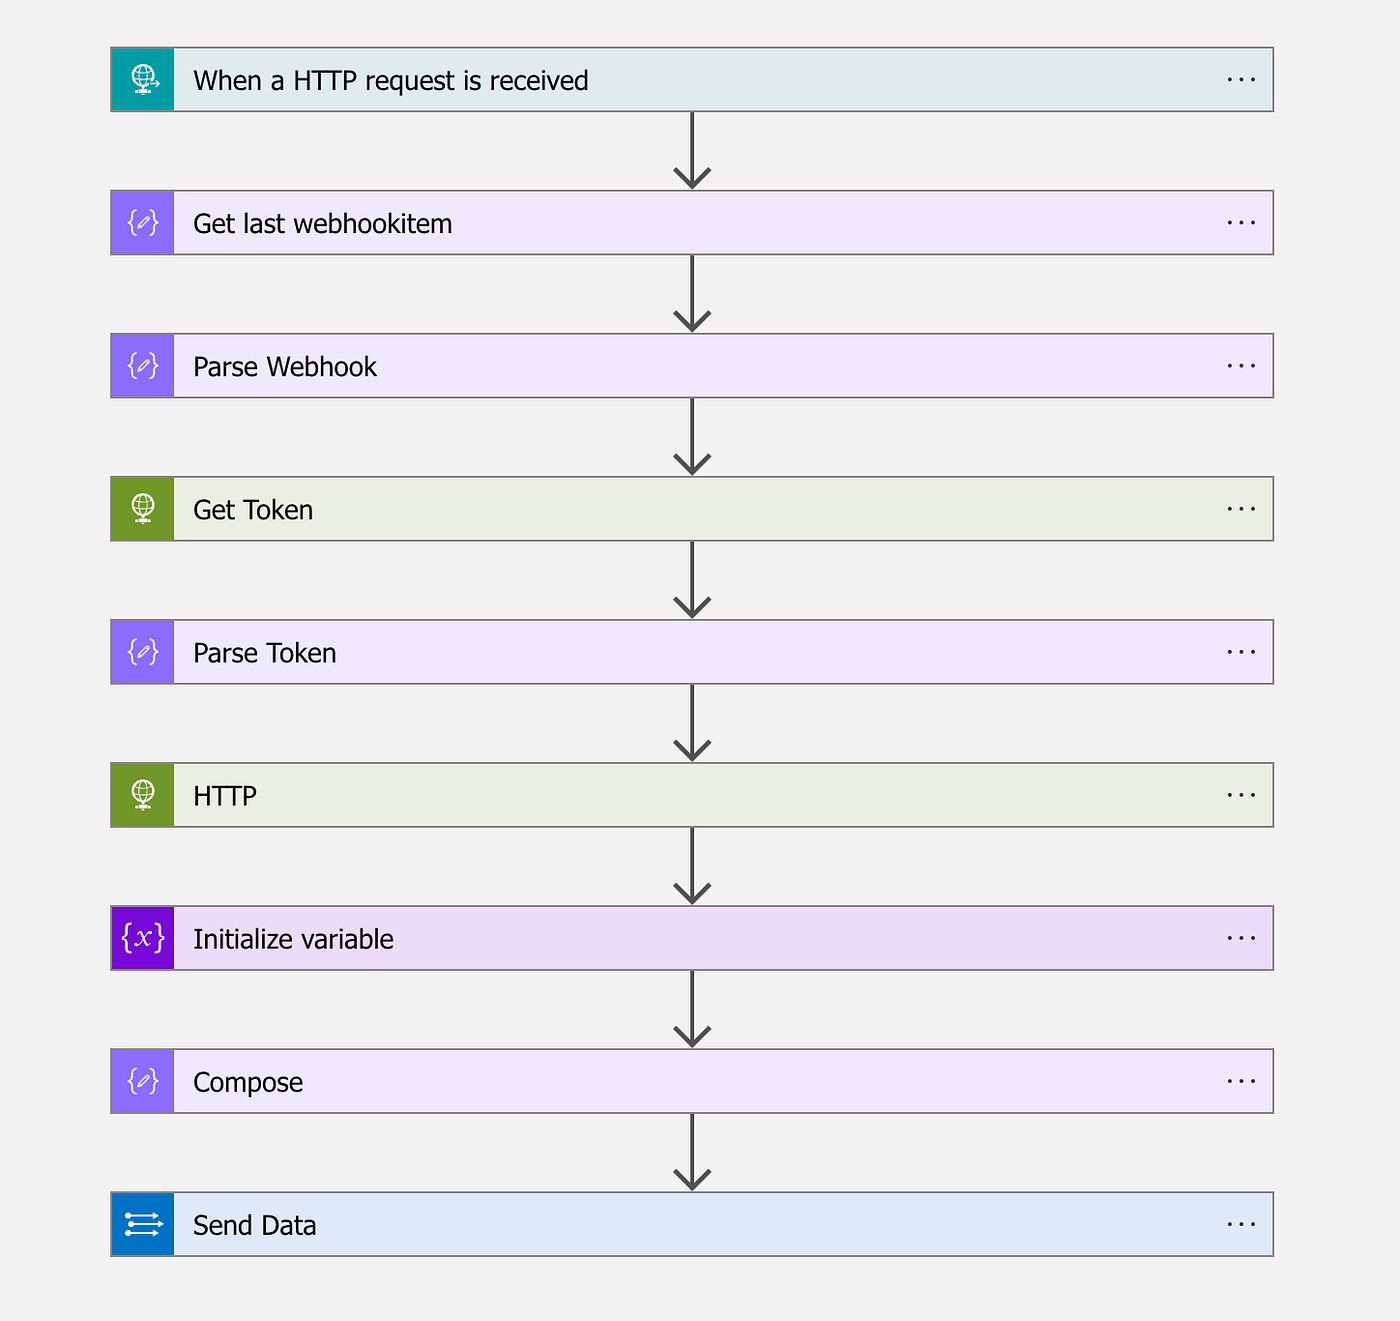
This Logic App will receive a webhook, then parses the submitted URLs containing the logs, gets a token and retrieves them. Next, it will dynamically generate the table names in Sentinel based on the contentType of these logs and submits them to the Sentinel API.
This will result in four custom tables being populated with Audit events.

While there are quite some interesting events in the custom tables, there is — contrary to what the documentation promises — nothing there for the M365D activities, like Live Response, etc. I do believe they are supposed to be there. I have seen it work briefly several months ago, but sadly, at the time of writing this blog, there is no telemetry in any of my tenants. You can query the same information via the Audit section on the M365D portal with the proper permissions, but also on the portal, there is nothing.
Service API
Since all information I wanted to have was visible on the M365D portal, I wanted to find out if I could get it myself. After some moments in the Developer Tools of the browser I quickly found what I was after.
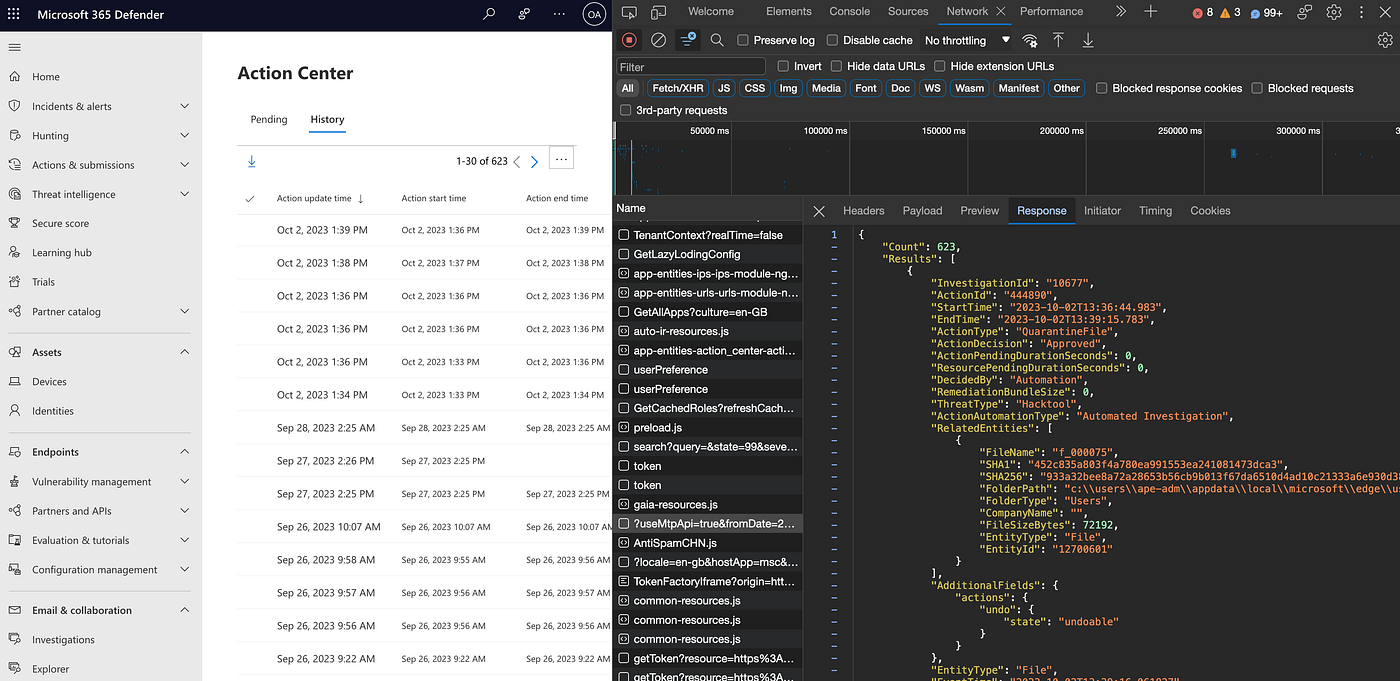
Obviously, this resulting JSON data is based on a request by clicking on the history in the interface, so looking at the header section I tried replicating the browser from a simple script. I copied the request URL and an access token and replayed that.

Sadly, this did not work that well. The apiproxy requires pretty specific cookies that I could not easily recreate. However, when I looked further, the return header had more promising information. This header contains all relevant information to access the Service API endpoint(s) for the information I was interested in.
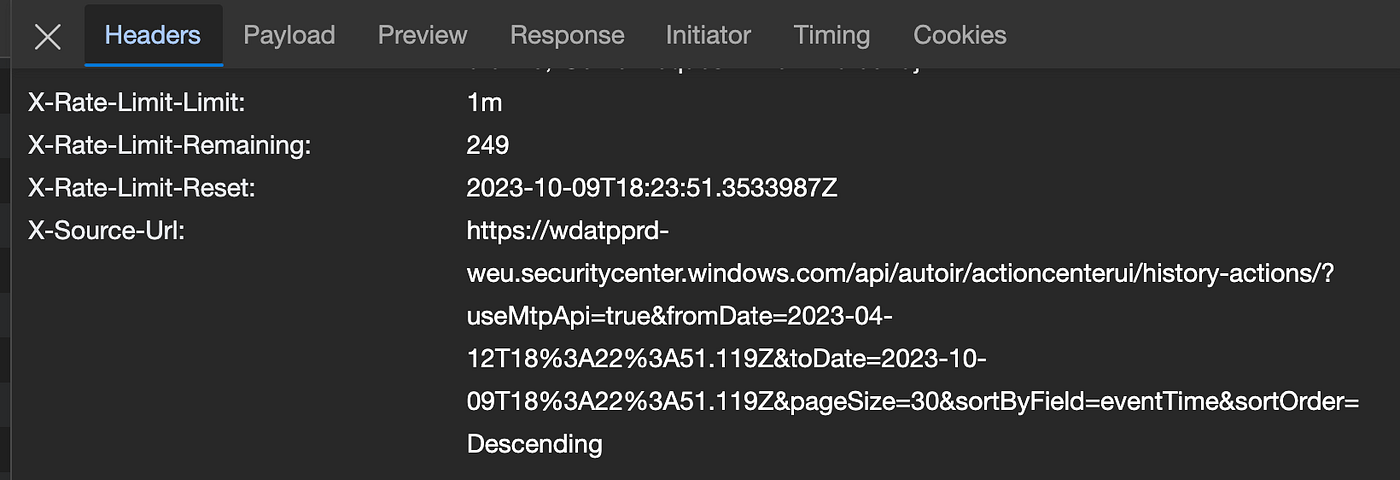
This URL can be broken up into 3 pieces:
– the domain part: “https://wdatpprd-weu.securitycenter.windows.com”
– the API endpoint: “/api/autoir/actioncenterui/history-actions/”
– the filters: “?useMtpApi=true&fromDate=2023–04–12T18%3A22%3A51.119Z&toDate=2023–10–09T18%3A22%3A51.119Z&pageSize=30&sortByField=eventTime&sortOrder=Descending”
Like most of Microsoft’s APIs, the filters of query parameters are based on the ODATA standard and are quite versatile.
With this endpoint discovered, I started looking for a reliable, long-term way of querying to automatically get this data out regularly. Sadly, all efforts to get access via a Service Principal, App Registration, or Managed Identity with delegated or direct permissions failed. These APIs really require a user account to access them. Which in a way makes sense, they are not designed to be accessed by anything else than the web portal.
The easiest way proved to be a trick my colleague Gijs taught me, via the az cli app. This app allows you to sign in to your tenant via a device-based authentication flow and it will store a refresh token on that machine which is valid for up to 90 days.
Introducing DefenderHarvester

With this rediscovered knowledge I started looking at all pages in the M365D portal that would be useful for detection or incident analysis. Trust me, there is a ton of interesting things to discover once you start playing with the portal. Maybe more on that in a future blog.
After digging though the portal for a while I came across the following data I was willing to carve out and save to a file or ship to Sentinel (or Splunk).
- LiveResponse events (MdeMachineActions)
- The state of your custom detections (MdeCustomDetectionState)
- Advanced feature settings (MdeAdvancedFeatureSettings)
- Configured Machine Groups (MdeMachineGroups)
- Connected App Registrations, and their use (MdeConnectedAppStats)
- All executed queries Scheduled/API/Portal (MdeExecutedQueries)
- Timeline events for devices (MdeTimelineEvens)
- The schema reference
For most of these events there is a tampering, health or abuse detection possibility. The Timeline has been covered in the previous article and is great for incident analysis. These API requests are fairly slow to respond, so ingesting Timeline telemetry for all your machines will not be feasible. However, pulling the last x hours for machines that have an alert/incident and ingesting those for additional analysis is great!
The schema reference is a great source to track all new events added to M365D. By pulling this schema reference once in a while and diffing it, you can see what was added and what can be investigated for new detection opportunities.
Naturally, now I was interested in all of the above described events, I spent some time to figure out how to get all these events out. This is why I built a small Go tool: DefenderHarvester.
It’s still relying on the az cli for the nice refresh token handling. This will require you to install it and log in with an account that has MDE privileges.
az login --use-device-code
DefenderHarvester can write to files or directly to Sentinel tables and Splunk, or a combination of them.
It’s been built with flexibility in mind, so you can run different actions at different schedules. You might want to run some every hour, others once a day or week.
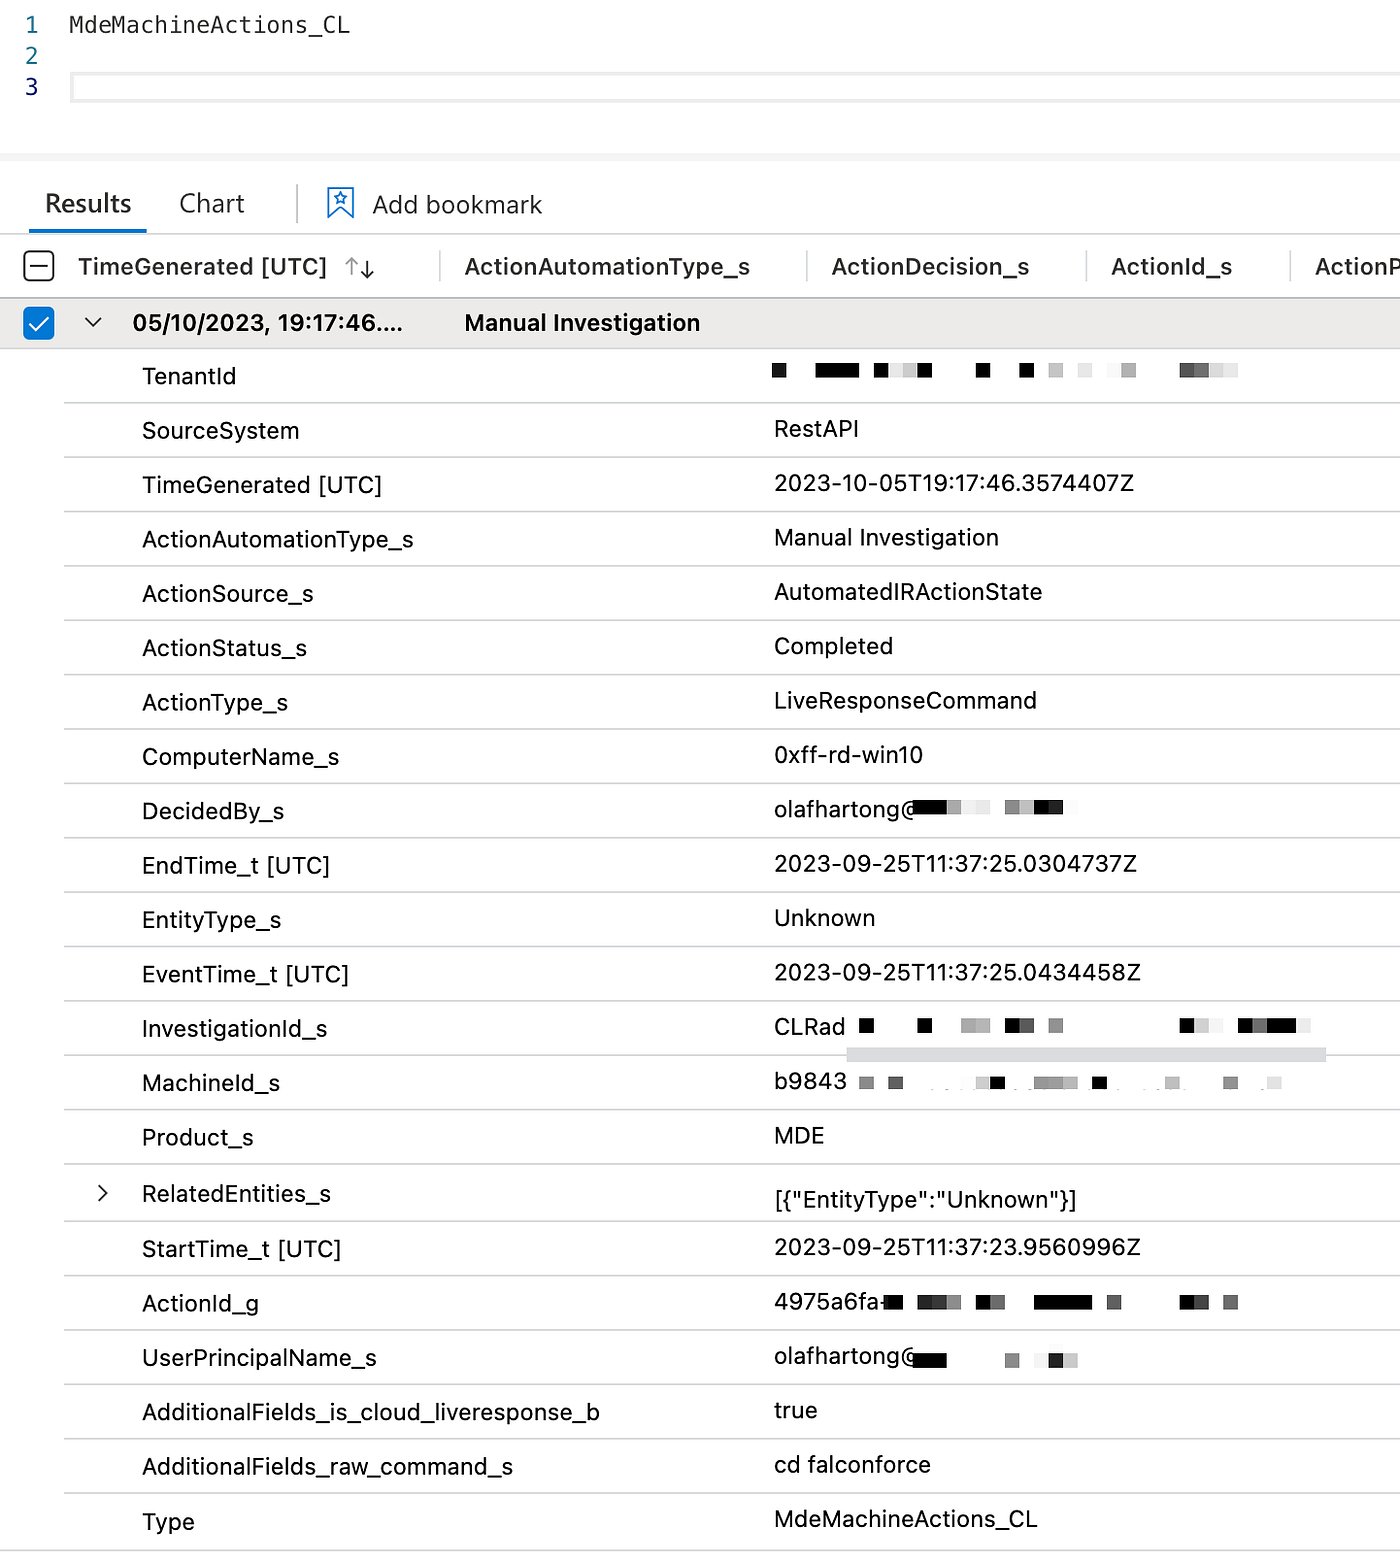
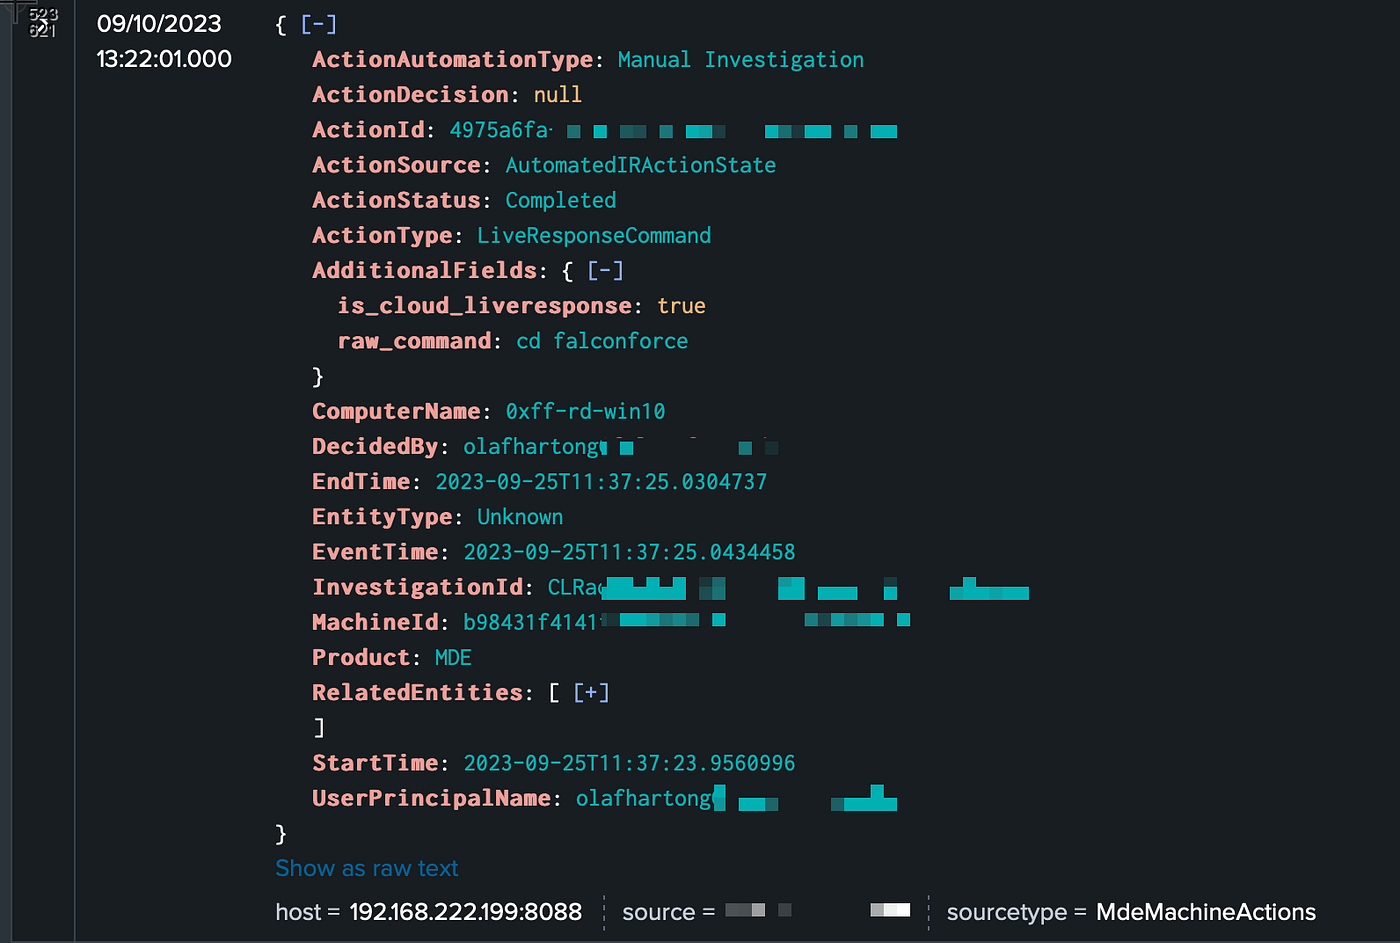
You can decide what to run and where you store the results on the command line.
Usage of ./defenderharvester: -connectedapps enable querying the Connected App Statistics -customdetections enable querying the Custom Detection state -executedqueries enable querying the Executed Queries -featuresettings enable querying the Advanced Feature Settings -files enable writing to files -lookback int set the number of hours to query from the applicable sources (default 1) -machineactions enable querying the MachineActions / LiveResponse actions -machinegroups enable querying the Machine Groups -machineid string set the MachineId to query the timeline for -schema enable writing the MDE schema reference to a file - will never write to Sentinel -sentinel enable sending to Sentinel -splunk enable sending to Splunk -timeline gather the Timeline for a MachineId (requires -machineid and -lookback)
To get the LiveResponse / MachineActions to Sentinel in the same way as in the screenshot above, you can run the following command:
./defenderharvester -lookback 24 -machineactions -sentinel
This works the same for most of the other commands. To get a Timeline out for a machine for the last week, you can run the following command (please note this can be quite a lot of information):
./defenderharvester -lookback 168 -machineid <machineid> -timeline -sentinel
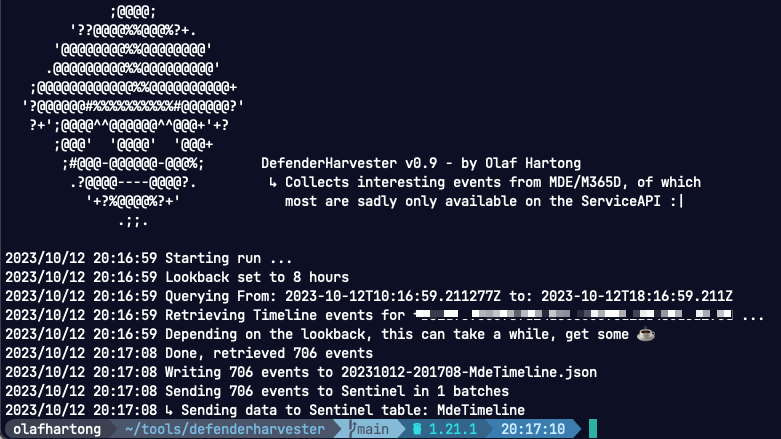
The timeline flag will store it to a file as well, which you can analyze with jless or jq or upload to your tool of choice.
The tool is written in Go for multi-platform support and, for instance, works great in a small Linux VM with the az cli and some small cron jobs.
Detection opportunities
With this new data there are tons of options for creating your own detections! For example:
- New script uploaded to Live Response.
- Sensitive actions on Live Response (run script, extract file).
- Sensitive queries executed via API or Portal.
- New App accessing M365D API, or significant interaction increase.
- Detection disabled by user.
- Detection failing.
- Change in advanced feature settings.
and much, much more!
Have fun building! If you don’t have time to build awesome detections yourself, please contact me and I can tell you more on FalconForce’s Sentry — Detect services — which includes a repository of over 450 advanced custom detections.
More
This article is part of a series, the other editions are listed below:
- Sysmon vs Microsoft Defender for Endpoint, MDE Internals 0x01
- Microsoft Defender for Endpoint Internals 0x02 — Audit Settings and Telemetry
- Microsoft Defender for Endpoint Internals 0x03 — MDE telemetry unreliability and log augmentation
- Microsoft Defender for Endpoint Internals 0x04 — Timeline telemetry
Knowledge center
Other articles
FalconFriday: Need for Speed: going underground with near-real-time (NRT) rules – 0xFF26
[dsm_breadcrumbs show_home_icon="off" separator_icon="K||divi||400" admin_label="Supreme Breadcrumbs" _builder_version="4.18.0" _module_preset="default" items_font="||||||||" items_text_color="rgba(255,255,255,0.6)" custom_css_main_element="color:...
How data science can boost your detection engineering maintenance and keep you from herding sheep
[dsm_breadcrumbs show_home_icon="off" separator_icon="K||divi||400" admin_label="Supreme Breadcrumbs" _builder_version="4.18.0" _module_preset="default" items_font="||||||||" items_text_color="rgba(255,255,255,0.6)" custom_css_main_element="color:...
Microsoft Defender for Endpoint Internal 0x06 – Custom Collection
[dsm_breadcrumbs show_home_icon="off" separator_icon="K||divi||400" admin_label="Supreme Breadcrumbs" _builder_version="4.18.0" _module_preset="default" items_font="||||||||" items_text_color="rgba(255,255,255,0.6)" custom_css_main_element="color:...

FalconForce realizes ambitions by working closely with its customers in a methodical manner, improving their security in the digital domain.
Energieweg 3
3542 DZ Utrecht
The Netherlands
FalconForce B.V.
[email protected]
(+31) 85 044 93 34
KVK 76682307
BTW NL860745314B01


